HTUSDT
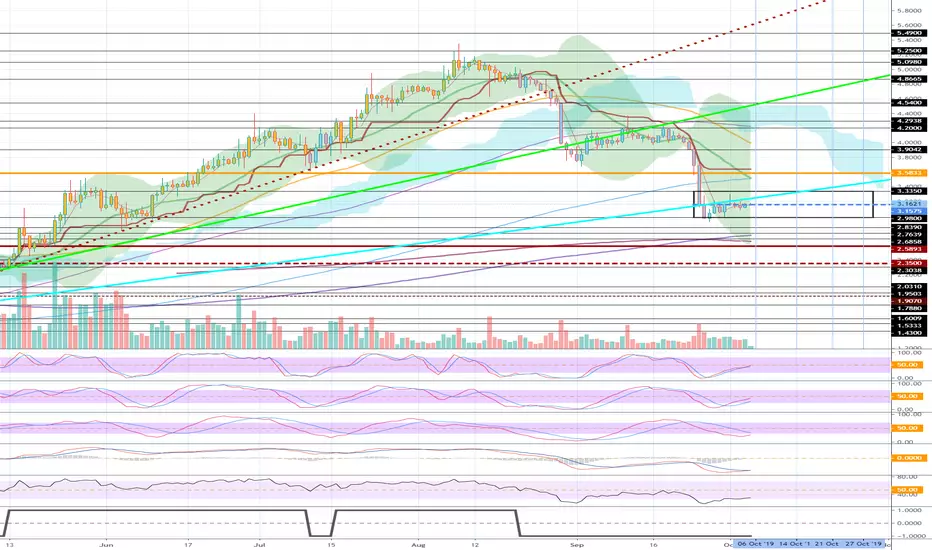
The sky blue uptrend line we drew on the previous chart is wrong.
HT is a bit off the light blue trend line, and I think it's a good position to keep the price.
The inflection date of the BTC chart is indicated.
We will see how the price of HT changes accordingly.
If you slowly climb along the upward trend line and reach 3.5833, you will see a full-fledged rise.
HT is a bit off the light blue trend line, and I think it's a good position to keep the price.
The inflection date of the BTC chart is indicated.
We will see how the price of HT changes accordingly.
If you slowly climb along the upward trend line and reach 3.5833, you will see a full-fledged rise.

[Practical trading strategy using HA-MS and SBOD]
youtu.be/aceN1AttX1Y
youtu.be/aceN1AttX1Y
Aviso legal
As informações e publicações não se destinam a ser, e não constituem, conselhos ou recomendações financeiras, de investimento, comerciais ou de outro tipo fornecidos ou endossados pela TradingView. Leia mais nos Termos de Uso.