
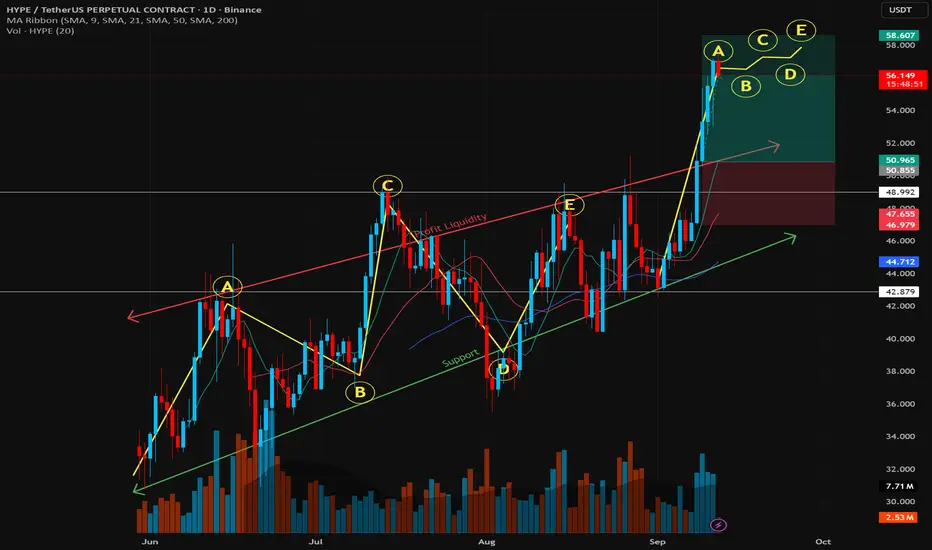
📚 Elliott Wave Trading Strategy — Education Framework
1. Origins & Philosophy
Ralph Nelson Elliott (1920s–1930s): Found that markets, while seeming chaotic, often move in repeating wave structures.
Core Belief: Market psychology cycles between optimism and pessimism in a fractal pattern.
Purpose: Provides a roadmap of where the market could be within a cycle (not a certainty).
2. The Two Types of Waves
Impulse (Motive) Waves (1–5):
Move in the direction of the main trend.
Rules:
Wave 2 never retraces >100% of Wave 1.
Wave 3 is never the shortest.
Wave 4 doesn’t overlap Wave 1.
Net result = trend continuation.
Corrective Waves (A–B–C):
Move against the main trend.
Three-wave structure: down (A), up (B), down (C) in a bull market.
Typically retraces a Fibonacci % of the prior impulse.
3. Key Components
Fractals: Small waves make up bigger ones, across timeframes.
Degrees of Waves: From Grand Supercycle (multi-century) to Subminuette (intraday).
Fibonacci Ratios: Common retracement levels (38.2%, 50%, 61.8%) and extensions (161.8%) guide targets.
4. Practical Trading Strategy
Elliott Wave by itself is subjective. The edge comes when combined with confirming indicators.
Example Workflow for Swing Trading
Identify Trend Direction:
Use 50-day/200-day MA, Ichimoku, or ADX.
Wave Counting:
Label impulse waves 1–5.
Wait for a corrective wave A–B–C.
Entry:
Many Enter end of Wave 2 or Wave 4 (buy dips in uptrend). Try entering a wave earlier, so that you lock in better Risk to Reward.
Use momentum oscillators (RSI/Stochastics) to confirm end of correction.
Exit/Profit Target:
Project Wave 3 or 5 using Fibonacci extensions (often 161.8% of Wave 1).
Stop Loss:
Below Wave 1 start (if long).
Above Wave 1 start (if short in a bear sequence).
5. Who Uses Elliott Wave?
Day Traders / Swing Traders: To catch impulse waves.
Long-term Investors: To avoid topping markets (useful in bubbles).
Cross-Market Traders: Applies in stocks, forex, commodities, crypto.
6. Advantages
✅ Provides forward-looking framework (not just lagging).
✅ Works across asset classes and timeframes.
✅ Helps identify where we are in a market cycle.
✅ Blends well with Fibonacci, RSI, and trend filters.
7. Disadvantages
❌ Highly subjective (two traders may count waves differently).
❌ No guarantee — probabilities, not certainties.
❌ Developed in the 1930s, critics argue it hasn’t adapted well to algorithmic/modern markets.
8. Famous Elliott Wave Calls
Dow 2002–03 Crash: Prechter predicted drop from 11,000 → 7,000.
Gold 2011 Peak: Predicted ~$1,900 top.
Bitcoin 2017: Analysts called $20K top → $3K.
9. Common Mistakes
Forcing wave counts (bias confirmation).
Ignoring other indicators.
Trading every wave → instead, focus on the big impulses.
No patience (wave structures can take weeks or months).
✅ Summary Strategy (Simple Version)
Use MAs or trendlines → determine main trend.
Count impulse waves → focus on Wave 3 and Wave 5 (strongest).
Wait for corrective pullback (Wave 2 or 4).
Enter with oscillator confirmation + Fibonacci retracement.
Exit at Fibonacci extension or trend exhaustion.
1. Origins & Philosophy
Ralph Nelson Elliott (1920s–1930s): Found that markets, while seeming chaotic, often move in repeating wave structures.
Core Belief: Market psychology cycles between optimism and pessimism in a fractal pattern.
Purpose: Provides a roadmap of where the market could be within a cycle (not a certainty).
2. The Two Types of Waves
Impulse (Motive) Waves (1–5):
Move in the direction of the main trend.
Rules:
Wave 2 never retraces >100% of Wave 1.
Wave 3 is never the shortest.
Wave 4 doesn’t overlap Wave 1.
Net result = trend continuation.
Corrective Waves (A–B–C):
Move against the main trend.
Three-wave structure: down (A), up (B), down (C) in a bull market.
Typically retraces a Fibonacci % of the prior impulse.
3. Key Components
Fractals: Small waves make up bigger ones, across timeframes.
Degrees of Waves: From Grand Supercycle (multi-century) to Subminuette (intraday).
Fibonacci Ratios: Common retracement levels (38.2%, 50%, 61.8%) and extensions (161.8%) guide targets.
4. Practical Trading Strategy
Elliott Wave by itself is subjective. The edge comes when combined with confirming indicators.
Example Workflow for Swing Trading
Identify Trend Direction:
Use 50-day/200-day MA, Ichimoku, or ADX.
Wave Counting:
Label impulse waves 1–5.
Wait for a corrective wave A–B–C.
Entry:
Many Enter end of Wave 2 or Wave 4 (buy dips in uptrend). Try entering a wave earlier, so that you lock in better Risk to Reward.
Use momentum oscillators (RSI/Stochastics) to confirm end of correction.
Exit/Profit Target:
Project Wave 3 or 5 using Fibonacci extensions (often 161.8% of Wave 1).
Stop Loss:
Below Wave 1 start (if long).
Above Wave 1 start (if short in a bear sequence).
5. Who Uses Elliott Wave?
Day Traders / Swing Traders: To catch impulse waves.
Long-term Investors: To avoid topping markets (useful in bubbles).
Cross-Market Traders: Applies in stocks, forex, commodities, crypto.
6. Advantages
✅ Provides forward-looking framework (not just lagging).
✅ Works across asset classes and timeframes.
✅ Helps identify where we are in a market cycle.
✅ Blends well with Fibonacci, RSI, and trend filters.
7. Disadvantages
❌ Highly subjective (two traders may count waves differently).
❌ No guarantee — probabilities, not certainties.
❌ Developed in the 1930s, critics argue it hasn’t adapted well to algorithmic/modern markets.
8. Famous Elliott Wave Calls
Dow 2002–03 Crash: Prechter predicted drop from 11,000 → 7,000.
Gold 2011 Peak: Predicted ~$1,900 top.
Bitcoin 2017: Analysts called $20K top → $3K.
9. Common Mistakes
Forcing wave counts (bias confirmation).
Ignoring other indicators.
Trading every wave → instead, focus on the big impulses.
No patience (wave structures can take weeks or months).
✅ Summary Strategy (Simple Version)
Use MAs or trendlines → determine main trend.
Count impulse waves → focus on Wave 3 and Wave 5 (strongest).
Wait for corrective pullback (Wave 2 or 4).
Enter with oscillator confirmation + Fibonacci retracement.
Exit at Fibonacci extension or trend exhaustion.

Aviso legal
As informações e publicações não se destinam a ser, e não constituem, conselhos ou recomendações financeiras, de investimento, comerciais ou de outro tipo fornecidos ou endossados pela TradingView. Leia mais nos Termos de Uso.
Aviso legal
As informações e publicações não se destinam a ser, e não constituem, conselhos ou recomendações financeiras, de investimento, comerciais ou de outro tipo fornecidos ou endossados pela TradingView. Leia mais nos Termos de Uso.