Long
ICX falling wedge - Indicating a potential breakout (FINALLY)
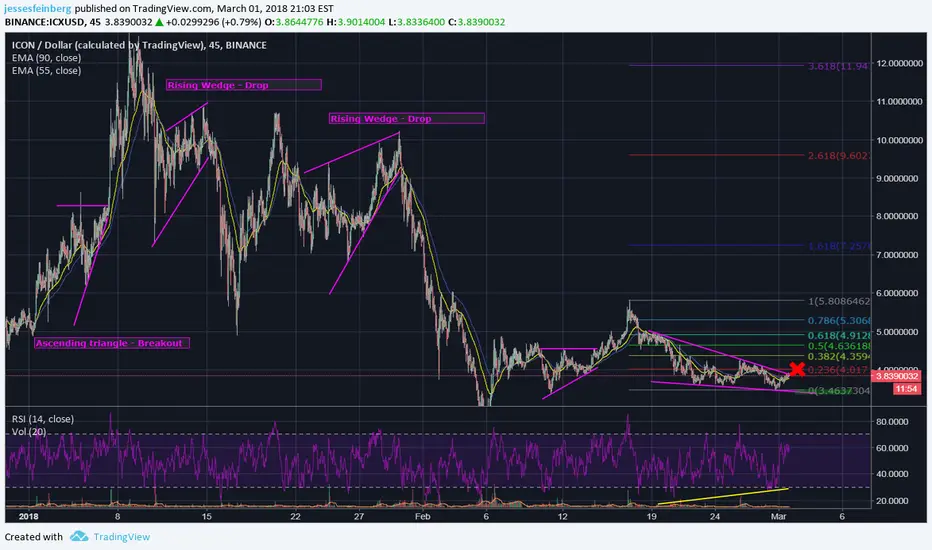
 ICXUSD is a project with both great fundamentals, and potentially great technical indicators at the moment. It got hit especially hard during the recent market correction, retracing over 80% to the current bottom (from a high over $12). I'm hoping for an equally strong rebound.
It has been following the rules pretty closely as far as wedge patterns. Ascending triangles are predicting a rise, while rising, or bearish, wedges are predicting a drop. We are consolidating within a falling, or bullish, wedge right now. This indicates a potential breakout. Bullish divergence on RSI could also indicate a trend change.
If you're curious, I used the USD pairing for the chart because it more accurately illustrates the wedge patterns, and the adherence to it that's particularly relevant.
What I'm watching for:
- If we break out of the wedge, I'll start buying when we have confirmation at the 0.236 fib level (X)
- If we get rejected, I would buy at the bottom of the wedge channel (green box)
Good luck, be safe, and as always, DO YOUR OWN RESEARCH! This analysis is only my opinion, and I may be an idiot! Thank you :)

Aviso legal
As informações e publicações não se destinam a ser, e não constituem, conselhos ou recomendações financeiras, de investimento, comerciais ou de outro tipo fornecidos ou endossados pela TradingView. Leia mais nos Termos de Uso.
Aviso legal
As informações e publicações não se destinam a ser, e não constituem, conselhos ou recomendações financeiras, de investimento, comerciais ou de outro tipo fornecidos ou endossados pela TradingView. Leia mais nos Termos de Uso.