Long
IDFC BULLISH
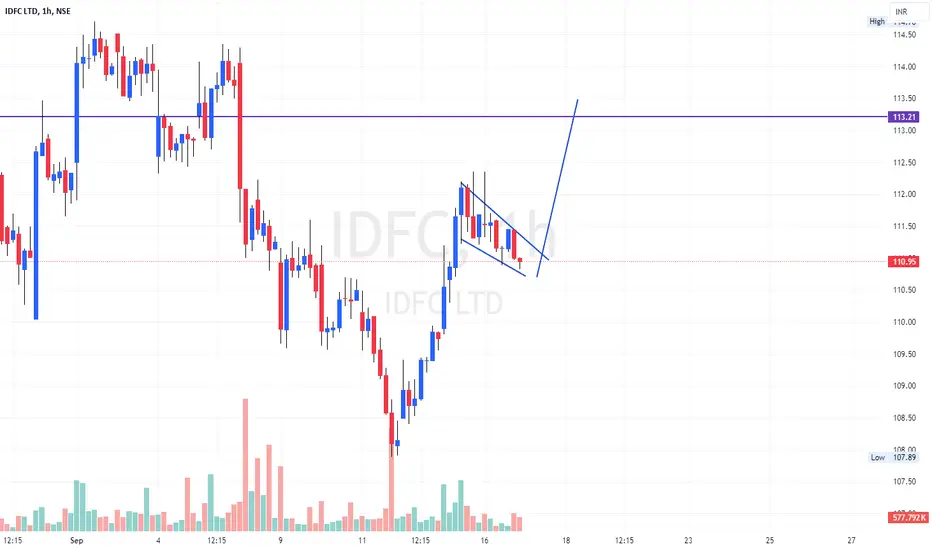
A Bullish Flag is a technical analysis pattern that suggests a potential continuation of a bullish trend. Here's a description of the Bullish Flag pattern in IDFC :
Pattern Description:
Flagpole: The stock price of IDFC has been in a strong uptrend, forming a flagpole (a sharp, almost vertical rise in price).
Consolidation: After the flagpole, the stock price has consolidated within a narrow range, forming a flag (a rectangular or triangular shape).
Upper and Lower Boundaries: The flag has upper and lower boundaries, which are roughly parallel to each other.
Breakout: The stock price is expected to break out above the upper boundary of the flag, continuing the bullish trend.
Pattern Description:
Flagpole: The stock price of IDFC has been in a strong uptrend, forming a flagpole (a sharp, almost vertical rise in price).
Consolidation: After the flagpole, the stock price has consolidated within a narrow range, forming a flag (a rectangular or triangular shape).
Upper and Lower Boundaries: The flag has upper and lower boundaries, which are roughly parallel to each other.
Breakout: The stock price is expected to break out above the upper boundary of the flag, continuing the bullish trend.
Nota
SL hit
Aviso legal
As informações e publicações não se destinam a ser, e não constituem, conselhos ou recomendações financeiras, de investimento, comerciais ou de outro tipo fornecidos ou endossados pela TradingView. Leia mais nos Termos de Uso.
Aviso legal
As informações e publicações não se destinam a ser, e não constituem, conselhos ou recomendações financeiras, de investimento, comerciais ou de outro tipo fornecidos ou endossados pela TradingView. Leia mais nos Termos de Uso.