
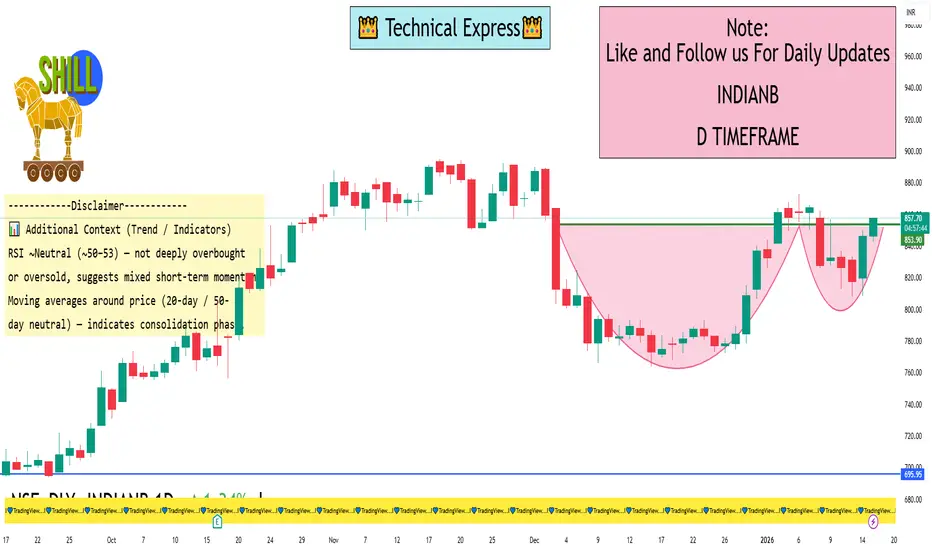
📌 Indian Bank – Daily Levels (Current / Accurate)Price Reference (Recent): ~₹832–₹835 area (last updated Jan 9-Jan 12, 2026)
🔹 Daily Pivot Point
Pivot: ~₹839.3 – ₹825.6 (multiple pivot sources)
📈 Resistance Levels
R1: ~₹850.6 – ₹838 area
R2: ~₹868.3
R3: ~₹879.6
(These are the daily upside barriers where selling pressure may emerge)
📉 Support Levels
S1: ~₹821.6 – ₹814 area
S2: ~₹810.3
S3: ~₹792.6 – ₹777 area
(These are key downside floors where buyers often step in)
🧠 How To Use These Levels (Daily Trading)
Bullish view (if price holds above pivot ~₹825–839 area):
✔ Above S1 (~₹821–822) — short-term bullish continuation likely
✔ Break above R1 (~₹850) — targets R2 (~₹868) then R3 (~₹880)
Bearish view (if price breaks below daily pivot / S1):
❌ Below S1 (~₹821) — weakness could push price toward S2 (~₹810)
❌ Sustained below S3 (~₹792–₹777) — could signal deeper correction
⚠️ Quick Reminder
These technical levels are based on latest publicly available pivot analysis and may differ slightly from live real-time data on your trading platform. Always verify live quotes on your charting tool before entering trades.
🔹 Daily Pivot Point
Pivot: ~₹839.3 – ₹825.6 (multiple pivot sources)
📈 Resistance Levels
R1: ~₹850.6 – ₹838 area
R2: ~₹868.3
R3: ~₹879.6
(These are the daily upside barriers where selling pressure may emerge)
📉 Support Levels
S1: ~₹821.6 – ₹814 area
S2: ~₹810.3
S3: ~₹792.6 – ₹777 area
(These are key downside floors where buyers often step in)
🧠 How To Use These Levels (Daily Trading)
Bullish view (if price holds above pivot ~₹825–839 area):
✔ Above S1 (~₹821–822) — short-term bullish continuation likely
✔ Break above R1 (~₹850) — targets R2 (~₹868) then R3 (~₹880)
Bearish view (if price breaks below daily pivot / S1):
❌ Below S1 (~₹821) — weakness could push price toward S2 (~₹810)
❌ Sustained below S3 (~₹792–₹777) — could signal deeper correction
⚠️ Quick Reminder
These technical levels are based on latest publicly available pivot analysis and may differ slightly from live real-time data on your trading platform. Always verify live quotes on your charting tool before entering trades.

Publicações relacionadas
Aviso legal
As informações e publicações não se destinam a ser, e não constituem, conselhos ou recomendações financeiras, de investimento, comerciais ou de outro tipo fornecidos ou endossados pela TradingView. Leia mais nos Termos de Uso.
Publicações relacionadas
Aviso legal
As informações e publicações não se destinam a ser, e não constituem, conselhos ou recomendações financeiras, de investimento, comerciais ou de outro tipo fornecidos ou endossados pela TradingView. Leia mais nos Termos de Uso.