
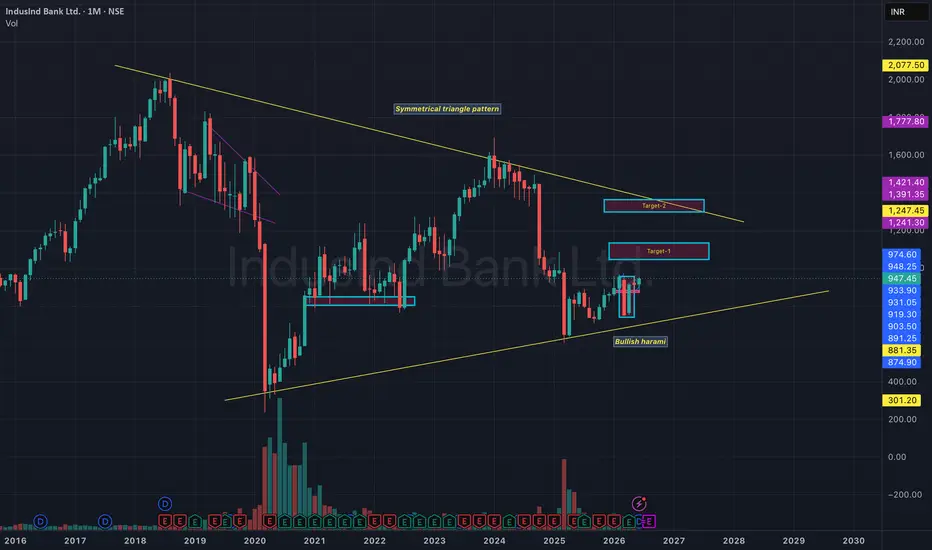
IndusInd Bank appears to be forming a long-term Symmetrical Triangle pattern, with price currently rebounding from the rising support trendline. After the sharp correction from previous highs, the stock has started showing signs of stabilization near the lower boundary of the broader structure.
Interestingly, the recent monthly candle formation resembles a Bullish Harami, indicating that selling pressure may be gradually exhausting and buyers are attempting to regain control.
Technical Observations:
🔹 Price is trading near the lower boundary of a multi-year triangle pattern
🔹 Rising support trendline continues to hold
🔹 Recent monthly candles suggest a Bullish Harami reversal setup
🔹 Historical support zones have triggered strong recoveries in the past
🔹 Risk-reward appears favorable near structural support
Potential Upside Zones:
✅ Target 1: ₹1,050–₹1,100
✅ Target 2: ₹1,240–₹1,280
Key Support:
🛑 Support Zone: ₹880–₹900
A sustained move above the immediate resistance levels could confirm a medium-term reversal and open the path toward the upper boundaries of the triangle.
Disclaimer: This analysis is shared solely for educational purposes and does not constitute investment advice. Please do your own research and maintain proper risk management.
Interestingly, the recent monthly candle formation resembles a Bullish Harami, indicating that selling pressure may be gradually exhausting and buyers are attempting to regain control.
Technical Observations:
🔹 Price is trading near the lower boundary of a multi-year triangle pattern
🔹 Rising support trendline continues to hold
🔹 Recent monthly candles suggest a Bullish Harami reversal setup
🔹 Historical support zones have triggered strong recoveries in the past
🔹 Risk-reward appears favorable near structural support
Potential Upside Zones:
✅ Target 1: ₹1,050–₹1,100
✅ Target 2: ₹1,240–₹1,280
Key Support:
🛑 Support Zone: ₹880–₹900
A sustained move above the immediate resistance levels could confirm a medium-term reversal and open the path toward the upper boundaries of the triangle.
Disclaimer: This analysis is shared solely for educational purposes and does not constitute investment advice. Please do your own research and maintain proper risk management.

Aviso legal
As informações e publicações não se destinam a ser, e não constituem, conselhos ou recomendações financeiras, de investimento, comerciais ou de outro tipo fornecidos ou endossados pela TradingView. Leia mais nos Termos de Uso.
Aviso legal
As informações e publicações não se destinam a ser, e não constituem, conselhos ou recomendações financeiras, de investimento, comerciais ou de outro tipo fornecidos ou endossados pela TradingView. Leia mais nos Termos de Uso.