
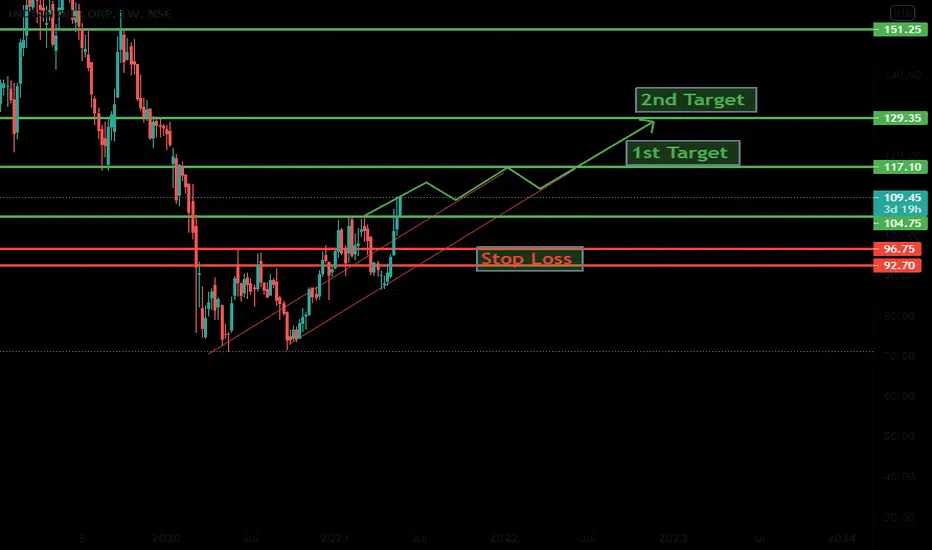
Price action in IOC shows price breaking out on Weakly chart. Price also closed above its 20 periods moving average and RSI shows a break out of a falling trendline and a pop above 70. This shows the stock is gaining momentum on the upside.
Buy around Rs 104-109 for a rally to Rs 118 and above that to Rs 130 over the next 2-3 weeks. Keep a stop below Rs 95.
Buy around Rs 104-109 for a rally to Rs 118 and above that to Rs 130 over the next 2-3 weeks. Keep a stop below Rs 95.
Trade ativo
1st Target Hit
Aviso legal
As informações e publicações não se destinam a ser, e não constituem, conselhos ou recomendações financeiras, de investimento, comerciais ou de outro tipo fornecidos ou endossados pela TradingView. Leia mais nos Termos de Uso.
Aviso legal
As informações e publicações não se destinam a ser, e não constituem, conselhos ou recomendações financeiras, de investimento, comerciais ou de outro tipo fornecidos ou endossados pela TradingView. Leia mais nos Termos de Uso.