
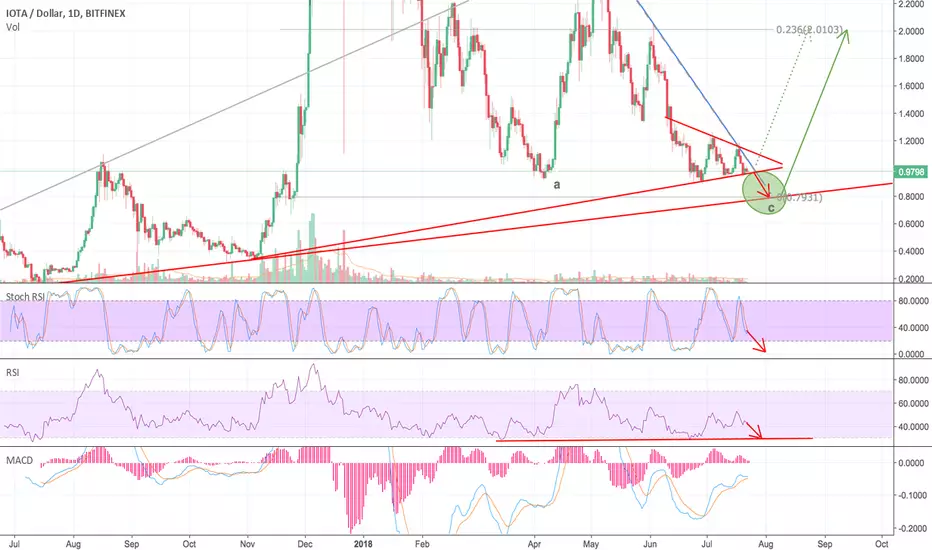
IOTA is moving inside a triangle which is formed by a strong support but at the same time a very strong resistance (coming from ATH) is crossing down the triangle. Daily Stoch RSI points down. RSI turned down. MACD neutral but might turn downward soon. In case IOTA breaks the support it might still continue to decline to ≈ 0.79$ level and there it will touch the trend line. IOTBTC chart doesn't look good at the moment.
Also given the fact that BTC might retrace a little bit since it is overbought and IOTA reacts to BTC downtrend with 2x I see this target easily reachable.
0.79$ level will be a good level to buy (depending on the price action)
------------------------------------------------------------
***** This is not a trading advice. Please invest responsibly *****
Also given the fact that BTC might retrace a little bit since it is overbought and IOTA reacts to BTC downtrend with 2x I see this target easily reachable.
0.79$ level will be a good level to buy (depending on the price action)
------------------------------------------------------------
***** This is not a trading advice. Please invest responsibly *****
Trade ativo
Trade fechado manualmente
Trade ativo
GOING LONGTrade fechado manualmente
going sidewaysTrade fechado manualmente
Nota
updtae here: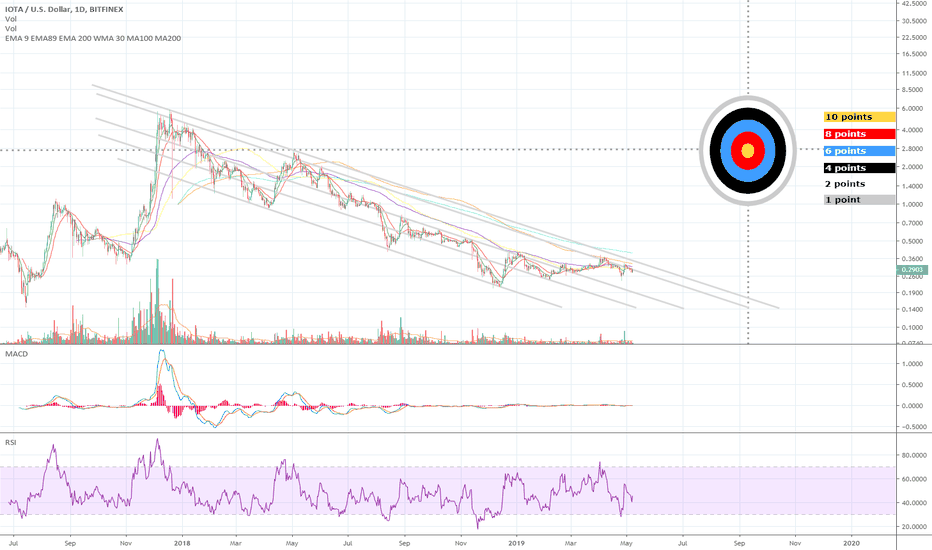

Aviso legal
As informações e publicações não se destinam a ser, e não constituem, conselhos ou recomendações financeiras, de investimento, comerciais ou de outro tipo fornecidos ou endossados pela TradingView. Leia mais nos Termos de Uso.
Aviso legal
As informações e publicações não se destinam a ser, e não constituem, conselhos ou recomendações financeiras, de investimento, comerciais ou de outro tipo fornecidos ou endossados pela TradingView. Leia mais nos Termos de Uso.