
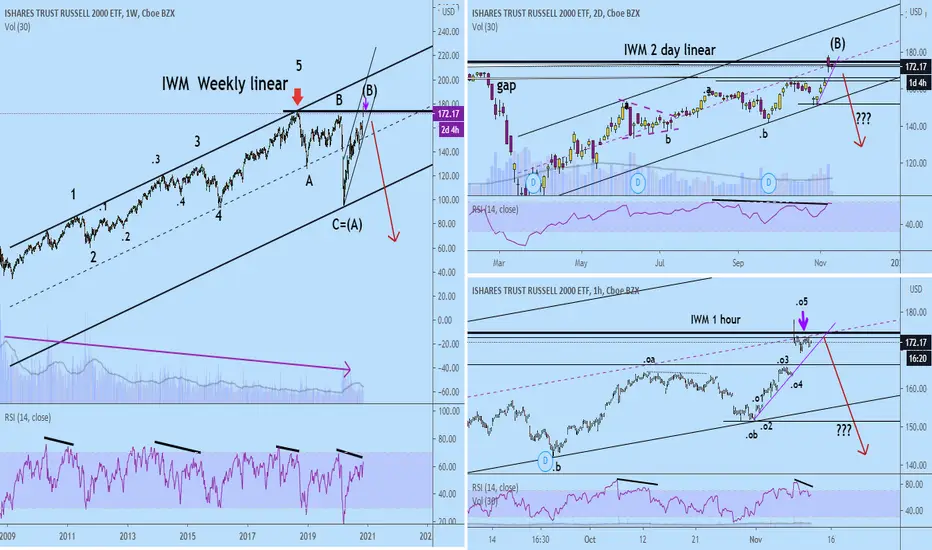
Recently I suggest a bounce up was likely and it was correct.(see link below). Here is my current favored EWT count. It is supported on the weekly by negative divergence in the weekly RSI and dropping volume. The same is true on the 2 day chart. Also the suggest down arrow on the the 2 day chart is right at the mid-channel line which often is a resistance or support line. All of this is my best guess. SO it is important to wait for price action to confirm. If price does not go above the down arrow on the 1 hour and drops below the near term 1 hour up trend line a I will take a partial position. A drop below the 2 day up channel would be a confirmation. BUT as always process your way. Best to ya.

Publicações relacionadas
Aviso legal
As informações e publicações não se destinam a ser, e não constituem, conselhos ou recomendações financeiras, de investimento, comerciais ou de outro tipo fornecidos ou endossados pela TradingView. Leia mais nos Termos de Uso.
Publicações relacionadas
Aviso legal
As informações e publicações não se destinam a ser, e não constituem, conselhos ou recomendações financeiras, de investimento, comerciais ou de outro tipo fornecidos ou endossados pela TradingView. Leia mais nos Termos de Uso.