
This is my favorite analysis
I give my qualified bid here on how NASDAQ and the market are going to evolve.
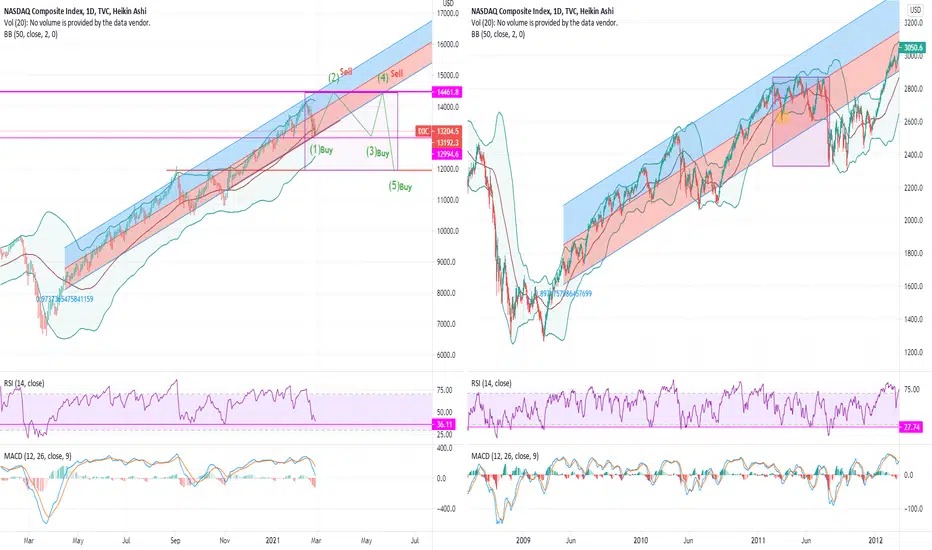
the graph is very similar to the financial crisis and makes exactly the same pattern, on top, bottom, RSI and MACD.
10-y bond have fallen and as I wrote in my other analysis, bonds will return to 0.95 and up again to 1.5. it's making a cup and handle now.
Follow the dates on the 1,2,3,4,5 wave and compare it with 10-y bond, and financial crisis(15. march 2011 to 17. june 2011).
I give my qualified bid here on how NASDAQ and the market are going to evolve.
the graph is very similar to the financial crisis and makes exactly the same pattern, on top, bottom, RSI and MACD.
10-y bond have fallen and as I wrote in my other analysis, bonds will return to 0.95 and up again to 1.5. it's making a cup and handle now.
Follow the dates on the 1,2,3,4,5 wave and compare it with 10-y bond, and financial crisis(15. march 2011 to 17. june 2011).

Publicações relacionadas
Aviso legal
As informações e publicações não se destinam a ser, e não constituem, conselhos ou recomendações financeiras, de investimento, comerciais ou de outro tipo fornecidos ou endossados pela TradingView. Leia mais nos Termos de Uso.
Publicações relacionadas
Aviso legal
As informações e publicações não se destinam a ser, e não constituem, conselhos ou recomendações financeiras, de investimento, comerciais ou de outro tipo fornecidos ou endossados pela TradingView. Leia mais nos Termos de Uso.