
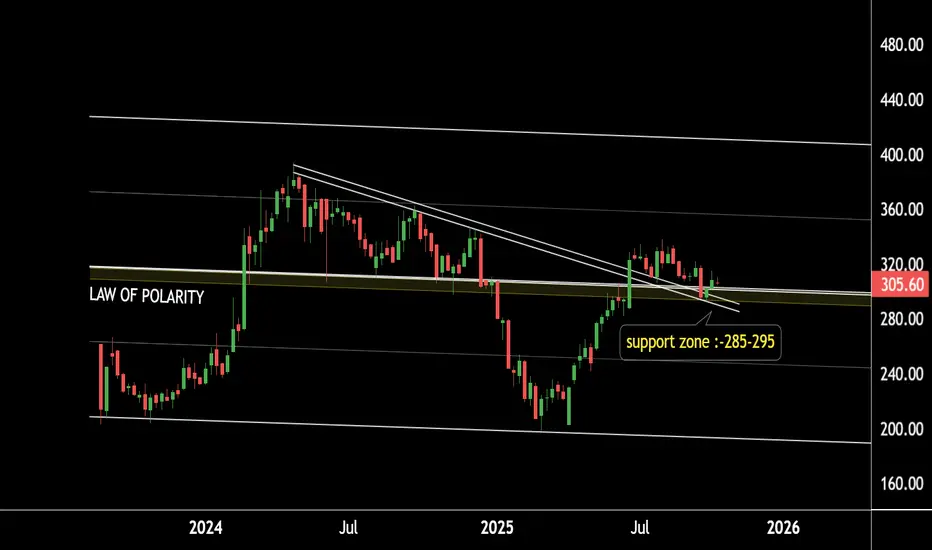
JIOFIN Weekly Chart Analysis
JIO Financial is showing strong price action on the weekly timeframe.
The stock is currently holding above a key law of polarity support zone around the ₹285–₹295 range.
It is also sustaining above its breakout level, with the retesting zone aligning near ₹285–₹300.
If this zone continues to hold, we may witness higher levels in JIOFIN in the coming sessions.
Conclusion:
Holding above 285–300 could trigger the next bullish leg.
JIO Financial is showing strong price action on the weekly timeframe.
The stock is currently holding above a key law of polarity support zone around the ₹285–₹295 range.
It is also sustaining above its breakout level, with the retesting zone aligning near ₹285–₹300.
If this zone continues to hold, we may witness higher levels in JIOFIN in the coming sessions.
Conclusion:
Holding above 285–300 could trigger the next bullish leg.

@RahulSarawagi
Connect us at optionlab.co.in/
Connect us at optionlab.co.in/
Aviso legal
As informações e publicações não se destinam a ser, e não constituem, conselhos ou recomendações financeiras, de investimento, comerciais ou de outro tipo fornecidos ou endossados pela TradingView. Leia mais nos Termos de Uso.
@RahulSarawagi
Connect us at optionlab.co.in/
Connect us at optionlab.co.in/
Aviso legal
As informações e publicações não se destinam a ser, e não constituem, conselhos ou recomendações financeiras, de investimento, comerciais ou de outro tipo fornecidos ou endossados pela TradingView. Leia mais nos Termos de Uso.