
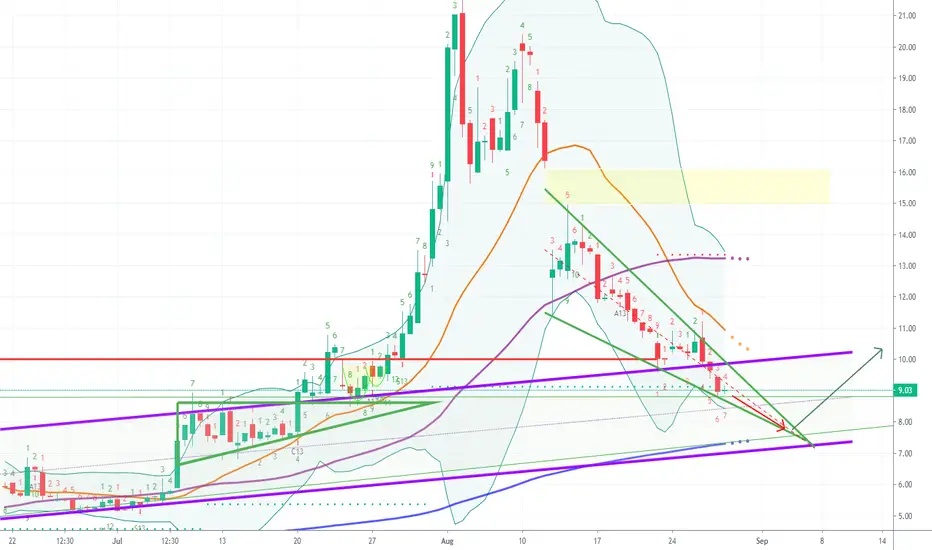
Firstly, I hate wedges, because they are like symmetric triangles that can be stretched and adjusted forever. But here is one way to draw it; 4 touches on the top and 3 on the bottom with an apex around $7.28 on 9/2. Just happens to be the bottom of a purple channel I also drew. If it gets that low, the RSI might get lower than 30 on the daily chart. Bears could get wrecked soon as the gap between $15-16 could get filled with ease.
Nota
Looks like it broke out. $10 could be a little resistance if it reaches that Tues/Wed. But watch out when it busts through $11, as it will likely go up fast.Nota
Taking a beating, but it bounced strong today around that long term purple support line around $7.49. It could go even lower for maximum pain, but wait and see next week.Nota
Volume very low past few days; JMIA is asleep with nobody watching. Could have bottomed out on Sep 4. The $8.75 area was support for a while from Aug 27 - Sep 3. Now it's resistance. If the price can do a strong breakout, with full body candles on the 4-hr chart above $8.75, it would be bullish in my opinion.Nota
The current chart looks absolutely horrible. But it's apparent to me that right now that JMIA is simply following the S&P 500. Especially on the 4hr chart. The good news for the bulls is that perhaps if there is a capitulation event, it will bounce back strong. Especially if the RSI goes under 30 on the daily chart. Currently RSI is around 36 on Sep 18. It's been falling like a stone nonstop since Aug 10. Eventually that gap at $16 will get filled. The TA is still telling me that it could still reverse from here. Especially knowing that a lot of traders sell their positions on Fridays. Monday could be a selloff in the opening hours, capitulate, but then rally and end up for the day for a big reversal daily candle with a long wick. If not Monday, I have no doubt it will happen eventually.Nota
Also, just look at this chart as if it was a bouncing ball. You will know what to do and when to buy when the ball stops bouncing on the floor.
Aviso legal
As informações e publicações não se destinam a ser, e não constituem, conselhos ou recomendações financeiras, de investimento, comerciais ou de outro tipo fornecidos ou endossados pela TradingView. Leia mais nos Termos de Uso.
Aviso legal
As informações e publicações não se destinam a ser, e não constituem, conselhos ou recomendações financeiras, de investimento, comerciais ou de outro tipo fornecidos ou endossados pela TradingView. Leia mais nos Termos de Uso.