
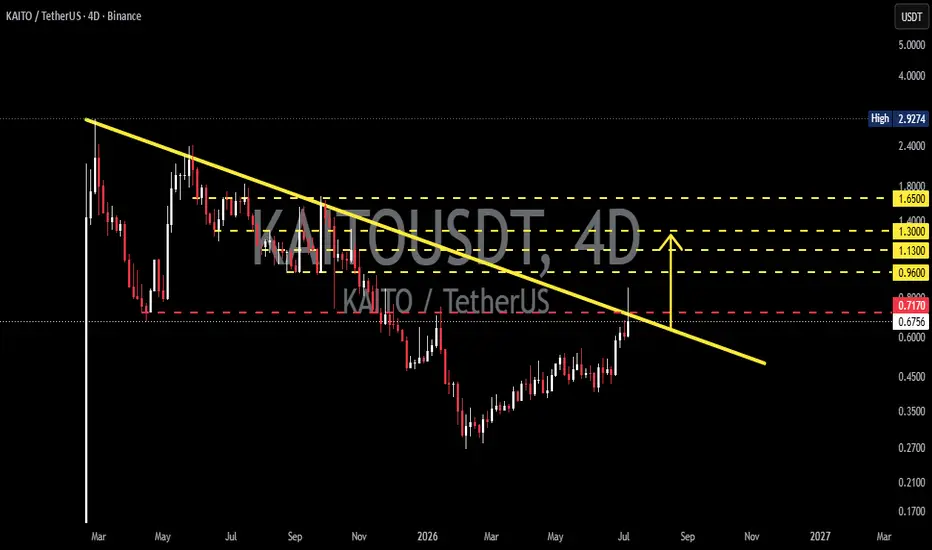
This chart shows that KAITO is currently testing a major resistance in the form of a Descending Trendline 📉 that has capped price action for several months. After forming a series of Higher Lows 📈, buying pressure is gradually increasing, and the price is now approaching a crucial decision zone. ⚠️
If buyers can maintain their momentum and deliver a valid breakout supported by strong trading volume 📊, the probability of a Trend Reversal will increase significantly. 🚀
━━━━━━━━━━━━━━━━━━━━
📊🔍 Pattern Formation: Descending Trendline Breakout Attempt
The chart is dominated by a Descending Trendline, connecting a series of Lower Highs from previous peaks.
✨ Pattern Characteristics:
🔸 Indicates seller dominance throughout the downtrend. 📉
🔸 The more frequently the resistance is tested, the greater the probability of a successful breakout. 💥
🔸 A valid breakout is typically confirmed by a candle close above the trendline accompanied by increasing trading volume. 📊
📍 At the moment, price is sitting right at this key confirmation area, making the next move extremely important for determining the future trend.
━━━━━━━━━━━━━━━━━━━━
🟢🚀 Bullish Scenario
The bullish outlook becomes stronger if:
✅ A 4D candle closes above the Descending Trendline.
✅ The resistance around 0.71 USDT successfully flips into support (successful retest).
If the breakout is confirmed, the next upside targets are:
🎯 Target 1: 0.96 USDT
🎯 Target 2: 1.13 USDT
🎯 Target 3: 1.30 USDT
🎯 Target 4: 1.65 USDT
📈 If the overall cryptocurrency market remains bullish, the probability of reaching these targets increases significantly.
━━━━━━━━━━━━━━━━━━━━
🔴📉 Bearish Scenario
A bearish scenario may develop if:
❌ Price fails to break above the Descending Trendline.
❌ Strong rejection occurs around the 0.71 USDT resistance level.
❌ The candle closes back below the breakout area, turning the move into a False Breakout (Bull Trap). ⚠️🐂
If this occurs, the price could revisit previous support levels and continue its consolidation phase or even resume the broader downtrend.
━━━━━━━━━━━━━━━━━━━━
📍🧭 Key Levels to Watch
🟡 Major Resistance Levels
🔸 0.71 USDT (Breakout Level)
🔸 0.96 USDT
🔸 1.13 USDT
🔸 1.30 USDT
🔸 1.65 USDT
🟢 Bullish Confirmation
✅ Breakout with a candle close above the trendline.
✅ Successful retest holding the breakout area as support.
✅ Increasing trading volume during the breakout. 📊
🔴 Bearish Confirmation
❌ Rejection from the Descending Trendline.
❌ False Breakout (Bull Trap). ⚠️
❌ Price moves back below the primary resistance level.
━━━━━━━━━━━━━━━━━━━━
📌💡 Conclusion
KAITO is currently at a Critical Decision Zone. ⚖️
The long-term Descending Trendline, which has capped price action for months, is now being tested once again. If a breakout is confirmed with a strong candle close and high trading volume, the market structure could shift from Bearish ➜ Bullish, opening the door for a potential rally toward 0.96–1.65 USDT. 🚀📈
However, traders should wait for proper breakout confirmation before making trading decisions, as the risk of a False Breakout remains high without a convincing close and sufficient volume. ⚠️
━━━━━━━━━━━━━━━━━━━━
> ⚠️ Disclaimer: This analysis is based solely on technical analysis and should not be considered financial advice. Always DYOR (Do Your Own Research) 🧐 and practice proper risk management 🛡️ before making any investment or trading decisions.
#KAITO #KAITOUSDT #Crypto #Cryptocurrency #Altcoin #Binance #TechnicalAnalysis #TradingView #PriceAction #Trendline #Breakout #Bullish #Bearish #Support #Resistance #CryptoTrading #SwingTrading #ChartAnalysis #DYOR #RiskManagement #TrendReversal #VolumeAnalysis #SmartMoney #CryptoInvestor 📈💎
If buyers can maintain their momentum and deliver a valid breakout supported by strong trading volume 📊, the probability of a Trend Reversal will increase significantly. 🚀
━━━━━━━━━━━━━━━━━━━━
📊🔍 Pattern Formation: Descending Trendline Breakout Attempt
The chart is dominated by a Descending Trendline, connecting a series of Lower Highs from previous peaks.
✨ Pattern Characteristics:
🔸 Indicates seller dominance throughout the downtrend. 📉
🔸 The more frequently the resistance is tested, the greater the probability of a successful breakout. 💥
🔸 A valid breakout is typically confirmed by a candle close above the trendline accompanied by increasing trading volume. 📊
📍 At the moment, price is sitting right at this key confirmation area, making the next move extremely important for determining the future trend.
━━━━━━━━━━━━━━━━━━━━
🟢🚀 Bullish Scenario
The bullish outlook becomes stronger if:
✅ A 4D candle closes above the Descending Trendline.
✅ The resistance around 0.71 USDT successfully flips into support (successful retest).
If the breakout is confirmed, the next upside targets are:
🎯 Target 1: 0.96 USDT
🎯 Target 2: 1.13 USDT
🎯 Target 3: 1.30 USDT
🎯 Target 4: 1.65 USDT
📈 If the overall cryptocurrency market remains bullish, the probability of reaching these targets increases significantly.
━━━━━━━━━━━━━━━━━━━━
🔴📉 Bearish Scenario
A bearish scenario may develop if:
❌ Price fails to break above the Descending Trendline.
❌ Strong rejection occurs around the 0.71 USDT resistance level.
❌ The candle closes back below the breakout area, turning the move into a False Breakout (Bull Trap). ⚠️🐂
If this occurs, the price could revisit previous support levels and continue its consolidation phase or even resume the broader downtrend.
━━━━━━━━━━━━━━━━━━━━
📍🧭 Key Levels to Watch
🟡 Major Resistance Levels
🔸 0.71 USDT (Breakout Level)
🔸 0.96 USDT
🔸 1.13 USDT
🔸 1.30 USDT
🔸 1.65 USDT
🟢 Bullish Confirmation
✅ Breakout with a candle close above the trendline.
✅ Successful retest holding the breakout area as support.
✅ Increasing trading volume during the breakout. 📊
🔴 Bearish Confirmation
❌ Rejection from the Descending Trendline.
❌ False Breakout (Bull Trap). ⚠️
❌ Price moves back below the primary resistance level.
━━━━━━━━━━━━━━━━━━━━
📌💡 Conclusion
KAITO is currently at a Critical Decision Zone. ⚖️
The long-term Descending Trendline, which has capped price action for months, is now being tested once again. If a breakout is confirmed with a strong candle close and high trading volume, the market structure could shift from Bearish ➜ Bullish, opening the door for a potential rally toward 0.96–1.65 USDT. 🚀📈
However, traders should wait for proper breakout confirmation before making trading decisions, as the risk of a False Breakout remains high without a convincing close and sufficient volume. ⚠️
━━━━━━━━━━━━━━━━━━━━
> ⚠️ Disclaimer: This analysis is based solely on technical analysis and should not be considered financial advice. Always DYOR (Do Your Own Research) 🧐 and practice proper risk management 🛡️ before making any investment or trading decisions.
#KAITO #KAITOUSDT #Crypto #Cryptocurrency #Altcoin #Binance #TechnicalAnalysis #TradingView #PriceAction #Trendline #Breakout #Bullish #Bearish #Support #Resistance #CryptoTrading #SwingTrading #ChartAnalysis #DYOR #RiskManagement #TrendReversal #VolumeAnalysis #SmartMoney #CryptoInvestor 📈💎

✅ Get Free Signals! Join Our Telegram Channel Here: t.me/TheCryptoNuclear
✅ Twitter: twitter.com/crypto_nuclear
✅ Join Bybit : partner.bybit.com/b/nuclearvip
✅ Benefits : Lifetime Trading Fee Discount -50%
✅ Twitter: twitter.com/crypto_nuclear
✅ Join Bybit : partner.bybit.com/b/nuclearvip
✅ Benefits : Lifetime Trading Fee Discount -50%
Aviso legal
As informações e publicações não se destinam a ser, e não constituem, conselhos ou recomendações financeiras, de investimento, comerciais ou de outro tipo fornecidos ou endossados pela TradingView. Leia mais nos Termos de Uso.
✅ Get Free Signals! Join Our Telegram Channel Here: t.me/TheCryptoNuclear
✅ Twitter: twitter.com/crypto_nuclear
✅ Join Bybit : partner.bybit.com/b/nuclearvip
✅ Benefits : Lifetime Trading Fee Discount -50%
✅ Twitter: twitter.com/crypto_nuclear
✅ Join Bybit : partner.bybit.com/b/nuclearvip
✅ Benefits : Lifetime Trading Fee Discount -50%
Aviso legal
As informações e publicações não se destinam a ser, e não constituem, conselhos ou recomendações financeiras, de investimento, comerciais ou de outro tipo fornecidos ou endossados pela TradingView. Leia mais nos Termos de Uso.