
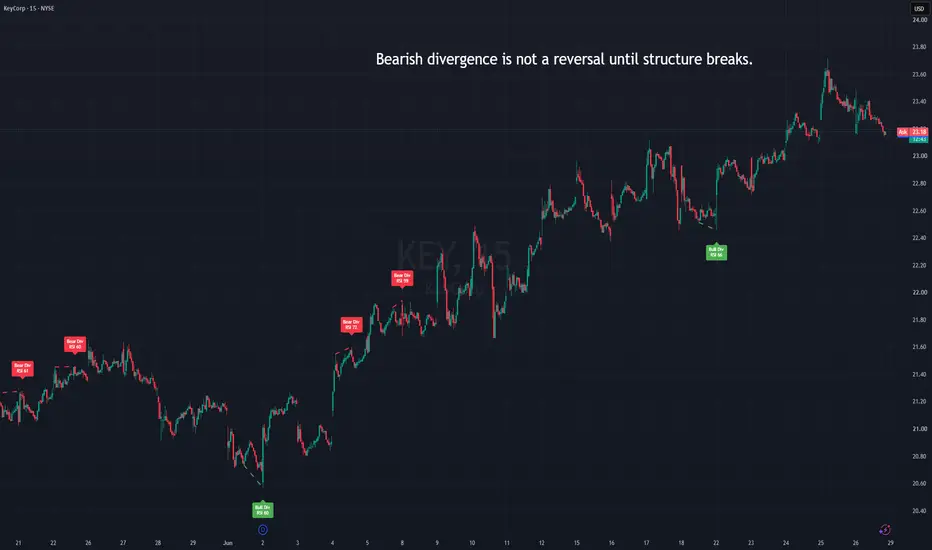
RSI divergence is useful, but it is often misunderstood.
Many traders see bearish divergence and immediately expect a reversal. The problem is that divergence does not mean price must reverse. It only means that momentum is no longer confirming the latest price move.
In a strong trend, this can happen several times before price actually changes direction.
What bearish RSI divergence shows
Bearish RSI divergence appears when:
– price makes a higher high
– RSI makes a lower high
This means upside momentum is weaker compared with the previous swing.
But weaker momentum is not the same as a confirmed trend reversal.
A strong trend can continue even while bearish RSI divergence appears.
Why divergence can fail
Most failed divergence signals happen because traders ignore the broader price structure.
For example:
– price continues forming higher lows
– pullbacks are quickly bought
– the broader trend remains intact
– volume does not confirm a reversal
– there is no clear breakdown after the divergence
In that environment, bearish divergence may only show temporary exhaustion, not a full reversal.
How I read it
I treat RSI divergence as a warning layer.
It tells me:
– momentum may be cooling
– the move may be stretched
– chasing new long entries may be riskier
– a pause or pullback may become more likely
But I do not treat it as an automatic short signal.
For bearish divergence to become more important, I want to see additional confirmation:
– price loses structure
– lower highs start forming
– an important support area breaks
– the next bounce is weak
– selling pressure follows through
Without that confirmation, divergence can remain only a warning.
Main idea
RSI divergence shows momentum disagreement.
Price structure shows whether that disagreement matters.
This is why divergence should not be used alone. It works best as part of a broader process that includes trend, structure, volume context and risk management.
Educational content only. Not financial advice.
Many traders see bearish divergence and immediately expect a reversal. The problem is that divergence does not mean price must reverse. It only means that momentum is no longer confirming the latest price move.
In a strong trend, this can happen several times before price actually changes direction.
What bearish RSI divergence shows
Bearish RSI divergence appears when:
– price makes a higher high
– RSI makes a lower high
This means upside momentum is weaker compared with the previous swing.
But weaker momentum is not the same as a confirmed trend reversal.
A strong trend can continue even while bearish RSI divergence appears.
Why divergence can fail
Most failed divergence signals happen because traders ignore the broader price structure.
For example:
– price continues forming higher lows
– pullbacks are quickly bought
– the broader trend remains intact
– volume does not confirm a reversal
– there is no clear breakdown after the divergence
In that environment, bearish divergence may only show temporary exhaustion, not a full reversal.
How I read it
I treat RSI divergence as a warning layer.
It tells me:
– momentum may be cooling
– the move may be stretched
– chasing new long entries may be riskier
– a pause or pullback may become more likely
But I do not treat it as an automatic short signal.
For bearish divergence to become more important, I want to see additional confirmation:
– price loses structure
– lower highs start forming
– an important support area breaks
– the next bounce is weak
– selling pressure follows through
Without that confirmation, divergence can remain only a warning.
Main idea
RSI divergence shows momentum disagreement.
Price structure shows whether that disagreement matters.
This is why divergence should not be used alone. It works best as part of a broader process that includes trend, structure, volume context and risk management.
Educational content only. Not financial advice.

US stocks · RSI divergence + EMA structure tools
Custom Pine Script indicators, alerts & dashboards
Development & tools: benefitman.netlify.app
Educational only. Not financial advice.
Custom Pine Script indicators, alerts & dashboards
Development & tools: benefitman.netlify.app
Educational only. Not financial advice.
Aviso legal
As informações e publicações não se destinam a ser, e não constituem, conselhos ou recomendações financeiras, de investimento, comerciais ou de outro tipo fornecidos ou endossados pela TradingView. Leia mais nos Termos de Uso.
US stocks · RSI divergence + EMA structure tools
Custom Pine Script indicators, alerts & dashboards
Development & tools: benefitman.netlify.app
Educational only. Not financial advice.
Custom Pine Script indicators, alerts & dashboards
Development & tools: benefitman.netlify.app
Educational only. Not financial advice.
Aviso legal
As informações e publicações não se destinam a ser, e não constituem, conselhos ou recomendações financeiras, de investimento, comerciais ou de outro tipo fornecidos ou endossados pela TradingView. Leia mais nos Termos de Uso.