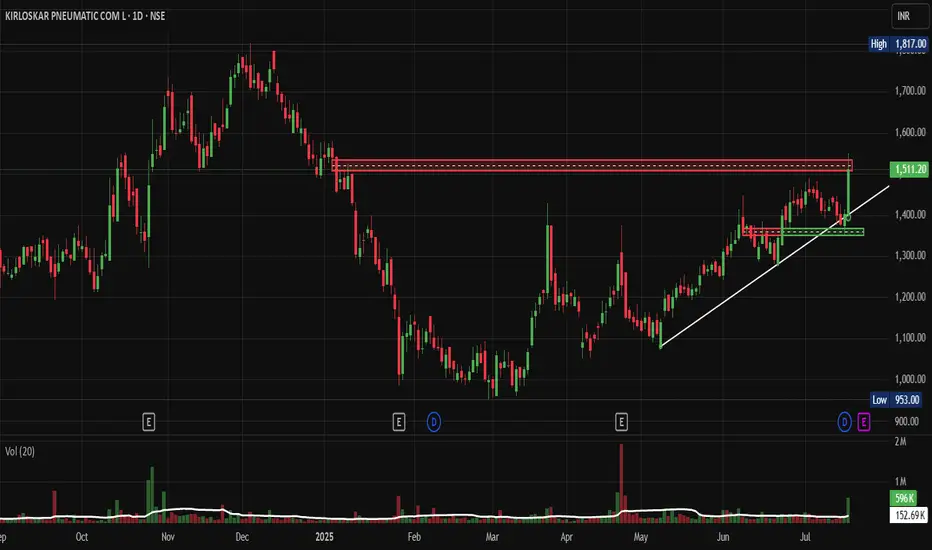
 KIRLPNU : A Technical Breakout Attempt That Could Deliver 25% Returns
Price Action Analysis:
- Current Price: Rs 1,511.20
- Day's High: Rs 1,817.00
- Day's Low: Rs 953.00
- Volume: 152.69K shares
Volume Spread Analysis:
Volume Profile:
- Significant volume spike during recent breakout attempt
- Volume during consolidation was relatively lower
- Current volume suggests institutional buying
- Volume trend supports price movement authenticity
Volume Indicators:
- Volume surge above 20-day average confirms breakout attempt
- Price-volume divergence absent, indicating a healthy move
- The accumulation phase is visible in the volume profile during base formation
Key Technical Observations:
- The stock has shown a strong upward momentum with a significant gap-up movement
- Price has moved from the consolidation zone around Rs 1,350-1,400 to the current levels
- Strong volume surge indicating institutional participation
- Daily candlestick pattern shows bullish momentum with long green candles
Technical Levels & Pattern Analysis:
Support Levels:
- Immediate Support: Rs 1,350-1,380 (previous resistance turned support)
- Strong Support: Rs 1,250-1,300 (multiple touch points)
- Major Support: Rs 1,100-1,150 (significant accumulation zone)
Resistance Levels:
- Immediate Resistance: Rs 1,550-1,580 (red horizontal line marked on chart)
- Next Resistance: Rs 1,650-1,700 (psychological level)
- Major Resistance: Rs 1,800-1,850 (day's high region)
Base Formation:
- Multi-month base formation visible from December 2024 to June 2025
- Consolidation range: Rs 1,100 to Rs 1,400
- Base breakout occurred around Rs 1,380-1,400 levels
- Volume expansion during breakout confirms strength
Technical Patterns:
- Cup and Handle pattern completion with breakout attempt
- Ascending triangle formation during the consolidation phase
- Bullish flag pattern on shorter timeframes
- Higher highs and higher lows trend intact
Trade Setup:
Entry Strategy:
- Primary Entry: Rs 1,480-1,520 (current market price on dips)
- Secondary Entry: Rs 1,350-1,380 (on pullback to support)
- Aggressive Entry: Rs 1,540-1,560 (breakout continuation)
Target Levels:
- Target 1: Rs 1,650-1,700 (8-12% upside)
- Target 2: Rs 1,800-1,850 (18-22% upside)
- Target 3: Rs 1,950-2,000 (25-30% upside)
Stop Loss Levels:
- Conservative Stop Loss: Rs 1,320 (below major support)
- Aggressive Stop Loss: Rs 1,420 (below immediate support)
- Trailing Stop Loss: Rs 1,480 (after first target achievement)
Risk Management:
Position Sizing:
- Conservative traders: 2-3% of portfolio
- Moderate traders: 4-5% of portfolio
- Aggressive traders: 6-8% of portfolio
- Risk per trade should not exceed 1-2% of total capital
Risk Assessment:
- Risk-Reward Ratio: 1:2 to 1:3 (favorable)
- Maximum drawdown potential: 12-15%
- Probability of success: 65-70% based on technical setup
Money Management Rules:
- Never risk more than 2% of capital per trade
- Use position sizing based on stop loss distance
- Maintain diversification across sectors
- Book partial profits at predetermined levels
Sectoral Backdrop:
Industry Overview:
-
KIRLPNU is engaged in the manufacturing and service of engineering goods, operating through the Compression Systems Segment, comprising air and gas compressors, air-conditioning and refrigeration- Industrial air compressor market to grow at 8.2% CAGR (2023-2033) with market share to reach US$6.86 Billion by 2033
Market Dynamics:
- India Air Compressor Market is forecast to reach $995 million by 2030, after growing at a CAGR of 5.2% during 2024-2030
- Manufacturing is expected to contribute 39.1% share of the market in 2025, as the industry relies heavily on compressed air for pneumatic tools
Growth Drivers:
- Increasing industrialization and infrastructure development
- Rising demand from the manufacturing and automotive sectors
- Energy-efficient compressor adoption
- Government initiatives supporting industrial growth
Fundamental Backdrop:
Financial Performance:
- Market Cap: 9,797 Crore with Revenue of 1,629 Cr and Profit of 211 Cr
- Revenue: ₹583Cr as on March 2025 (Q4 FY25) with Net Profit: ₹81Cr
- Annual revenue growth of 23% is outstanding, Pre-tax margin of 17% is great, ROE of 21.1% is exceptional, ROCE of 28.3% is also exceptional
Key Metrics:
- The stock is trading at 8.95 times its book value
- The company is debt-free and has a strong balance sheet, enabling stable earnings growth
- Promoter holding has decreased over the last 3 years: -14.8% with current Promoter Holding: 38.85%
Analyst Outlook:
- Recent research reports show an average share price target of 1784
- Strong financial metrics support technical breakout
- Debt-free status provides financial flexibility
- Consistent profitability across business cycles
Investment Thesis Summary:
Bullish Factors:
- Strong technical breakout attempt with volume confirmation
- Robust financial performance with 23.14% revenue growth
- Favourable industry growth prospects
- Debt-free balance sheet providing stability
Risk Factors:
- General market volatility
- Sector-specific cyclical risks
- Global economic uncertainties
- Promoter holding reduction trend
My Take:
KIRLPNU presents a compelling technical setup with strong fundamental backing. The recent breakout attempt from multi-month consolidation, supported by volume surge and positive sector outlook, creates an attractive risk-reward opportunity for medium-term investors. The company's strong financial metrics and debt-free status add confidence to the technical setup.Keep in the Watchlist.
NO RECO. For Buy/Sell.
📌Thank you for exploring my idea! I hope you found it valuable.
🙏FOLLOW for more
👍BOOST if you found it useful.
✍️COMMENT below with your views.
Meanwhile, check out my other stock ideas on the right side until this trade is activated. I would love your feedback.
Disclaimer: "I am not a SEBI REGISTERED RESEARCH ANALYST AND INVESTMENT ADVISER."
This analysis is intended solely for informational and educational purposes and should not be interpreted as financial advice. It is advisable to consult a qualified financial advisor or conduct thorough research before making investment decisions.

Publicações relacionadas
Aviso legal
As informações e publicações não se destinam a ser, e não constituem, conselhos ou recomendações financeiras, de investimento, comerciais ou de outro tipo fornecidos ou endossados pela TradingView. Leia mais nos Termos de Uso.
Publicações relacionadas
Aviso legal
As informações e publicações não se destinam a ser, e não constituem, conselhos ou recomendações financeiras, de investimento, comerciais ou de outro tipo fornecidos ou endossados pela TradingView. Leia mais nos Termos de Uso.