Short
KP3RUSDT is testing the support
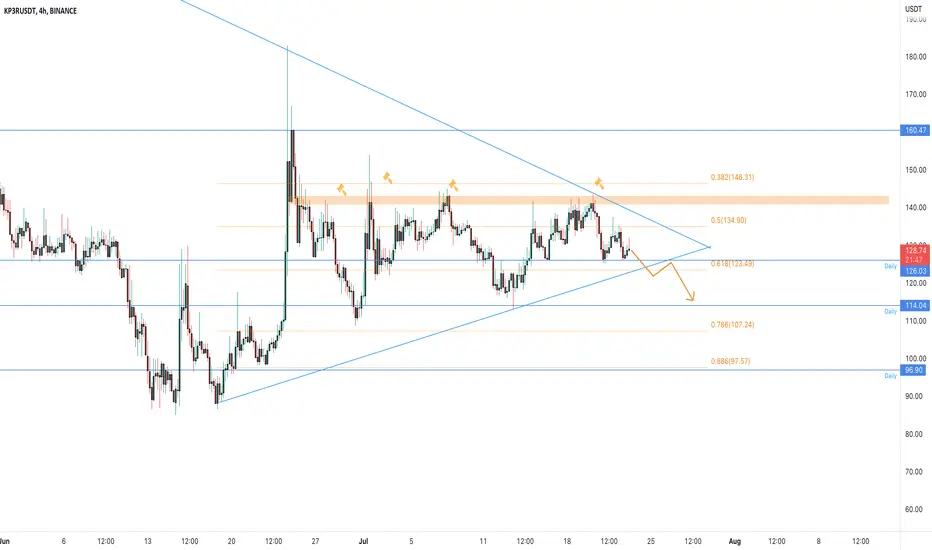
The price created a big triangle on the daily timeframe and now the market is testing the daily support at 128$ on 0.618 Fibonacci level.
On the 4h timeframe, the price got several rejections from 140$ area where the market created a local resistance after a nice bullish movement from 90$ area.
How to approach it?
IF the price is going to lose the 0.618 Fibonacci level support, we could see a bearish impulse until the previous support, so, According to Plancton's strategy, we can set a nice order
–––––
Keep in mind.
–––––
Follow the Shrimp 🦐
On the 4h timeframe, the price got several rejections from 140$ area where the market created a local resistance after a nice bullish movement from 90$ area.
How to approach it?
IF the price is going to lose the 0.618 Fibonacci level support, we could see a bearish impulse until the previous support, so, According to Plancton's strategy, we can set a nice order
–––––
Keep in mind.
- 🟣 Purple structure -> Monthly structure.
- 🔴 Red structure -> Weekly structure.
- 🔵 Blue structure -> Daily structure.
- 🟡 Yellow structure -> 4h structure.
–––––
Follow the Shrimp 🦐
Nota
we are waiting for the clear breakout. Beware of Fake breakout.As you know, the price needs to confirm the breakout with our strategies
Nota
Breakout and MTB strategy.5% so far
Nota
the price followed my arrow. 8%
Aviso legal
As informações e publicações não se destinam a ser, e não constituem, conselhos ou recomendações financeiras, de investimento, comerciais ou de outro tipo fornecidos ou endossados pela TradingView. Leia mais nos Termos de Uso.
Aviso legal
As informações e publicações não se destinam a ser, e não constituem, conselhos ou recomendações financeiras, de investimento, comerciais ou de outro tipo fornecidos ou endossados pela TradingView. Leia mais nos Termos de Uso.