
Technical Analysis: PSX Index (KSE-100) – 1-Hour Timeframe
By The Chart Alchemist
---
Market Structure Overview
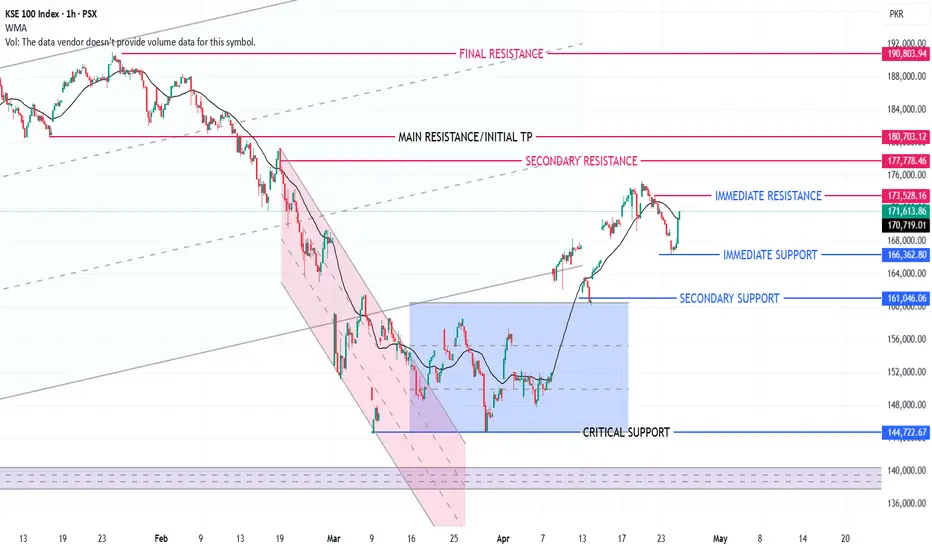
After reaching its all-time high, the index entered a bearish correction, with the latter phase confined within a defined bearish channel (light pink). This was followed by a lateral consolidation phase forming a horizontal range (light blue), characteristic of a Wyckoff accumulation structure.
---
Breakout & Trend Development
The index has successfully broken out of the accumulation range, signaling a structural shift toward bullish continuation. Price action has already completed two impulsive upward legs, and one additional push to the upside is anticipated before any significant correction.
---
Upside Projection
The ongoing bullish leg is expected to extend toward the primary oblique resistance, which also serves as the initial target at:
180,700 points
---
Support Levels
Immediate Support: 166,360
Secondary Support: 161,000
Critical Support: 144,700
---
Resistance Levels
Immediate Resistance: 171,600
Secondary Resistance: 177,780
Main Resistance / Initial Target: 180,700
Final Resistance: 190,800
---
Conclusion
The index maintains a bullish bias on the 1-hour timeframe, with strong potential for further upside continuation toward the 180,700 level before any major corrective phase develops.
By The Chart Alchemist
---
Market Structure Overview
After reaching its all-time high, the index entered a bearish correction, with the latter phase confined within a defined bearish channel (light pink). This was followed by a lateral consolidation phase forming a horizontal range (light blue), characteristic of a Wyckoff accumulation structure.
---
Breakout & Trend Development
The index has successfully broken out of the accumulation range, signaling a structural shift toward bullish continuation. Price action has already completed two impulsive upward legs, and one additional push to the upside is anticipated before any significant correction.
---
Upside Projection
The ongoing bullish leg is expected to extend toward the primary oblique resistance, which also serves as the initial target at:
180,700 points
---
Support Levels
Immediate Support: 166,360
Secondary Support: 161,000
Critical Support: 144,700
---
Resistance Levels
Immediate Resistance: 171,600
Secondary Resistance: 177,780
Main Resistance / Initial Target: 180,700
Final Resistance: 190,800
---
Conclusion
The index maintains a bullish bias on the 1-hour timeframe, with strong potential for further upside continuation toward the 180,700 level before any major corrective phase develops.

Aviso legal
As informações e publicações não se destinam a ser, e não constituem, conselhos ou recomendações financeiras, de investimento, comerciais ou de outro tipo fornecidos ou endossados pela TradingView. Leia mais nos Termos de Uso.
Aviso legal
As informações e publicações não se destinam a ser, e não constituem, conselhos ou recomendações financeiras, de investimento, comerciais ou de outro tipo fornecidos ou endossados pela TradingView. Leia mais nos Termos de Uso.