
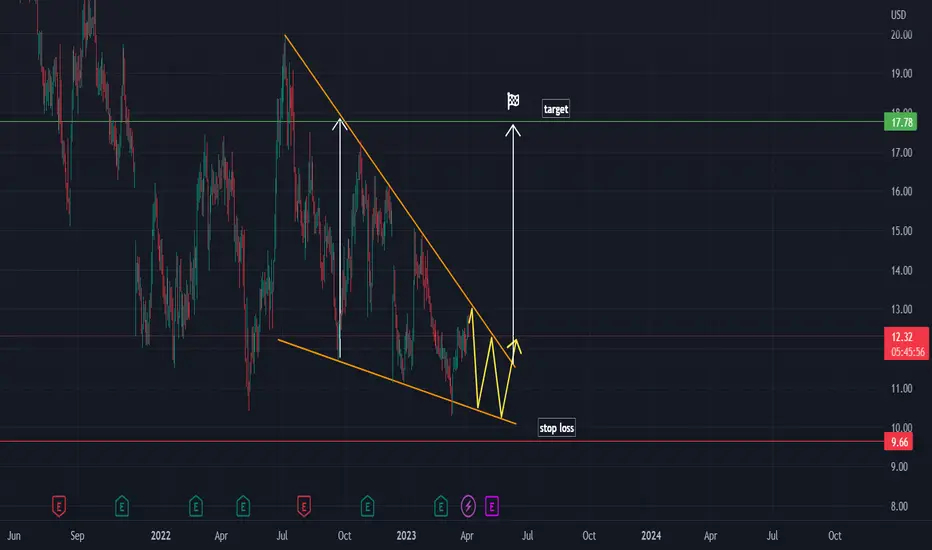
On this chart there is a falling wedge pattern.
The price is continuing to move inside the pattern.
We expect it to retest the trendline before bouncing up. Once it breaks out of the pattern it would be a good time to enter the long position.
Target and stop loss are shown on the chart.
The price is continuing to move inside the pattern.
We expect it to retest the trendline before bouncing up. Once it breaks out of the pattern it would be a good time to enter the long position.
Target and stop loss are shown on the chart.

💥 Free signals and ideas ➡ t.me/vfinvestment
Aviso legal
As informações e publicações não se destinam a ser, e não constituem, conselhos ou recomendações financeiras, de investimento, comerciais ou de outro tipo fornecidos ou endossados pela TradingView. Leia mais nos Termos de Uso.
💥 Free signals and ideas ➡ t.me/vfinvestment
Aviso legal
As informações e publicações não se destinam a ser, e não constituem, conselhos ou recomendações financeiras, de investimento, comerciais ou de outro tipo fornecidos ou endossados pela TradingView. Leia mais nos Termos de Uso.