
Overview
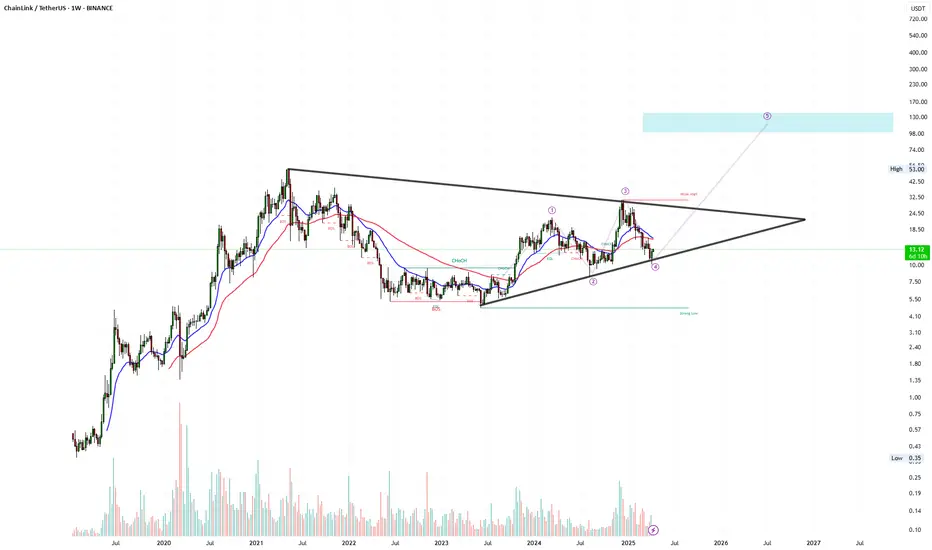
Chainlink (LINK) is experiencing an interesting price movement on the weekly timeframe, forming a Symmetric Triangle pattern. This pattern is a strong technical formation that often precedes significant price movements upon breaking one of its sides. This analysis focuses on the pattern, key resistance and support levels, and price expectations if the resistance is broken.
Symmetric Triangle Pattern
Pattern Formation: The Symmetric Triangle forms as price volatility gradually contracts, creating two converging trendlines (a descending resistance line and an ascending support line). On Chainlink’s weekly timeframe, this pattern is clearly visible, indicating a consolidation period before a major price move.
Time Duration: The pattern has persisted for several weeks, enhancing its technical significance, as longer-term patterns are generally more reliable.
Trading Volume: A gradual decrease in trading volume is observed as the price approaches the triangle’s apex, a typical behavior reflecting traders’ anticipation of an imminent breakout.

Aviso legal
As informações e publicações não se destinam a ser, e não constituem, conselhos ou recomendações financeiras, de investimento, comerciais ou de outro tipo fornecidos ou endossados pela TradingView. Leia mais nos Termos de Uso.
Aviso legal
As informações e publicações não se destinam a ser, e não constituem, conselhos ou recomendações financeiras, de investimento, comerciais ou de outro tipo fornecidos ou endossados pela TradingView. Leia mais nos Termos de Uso.