
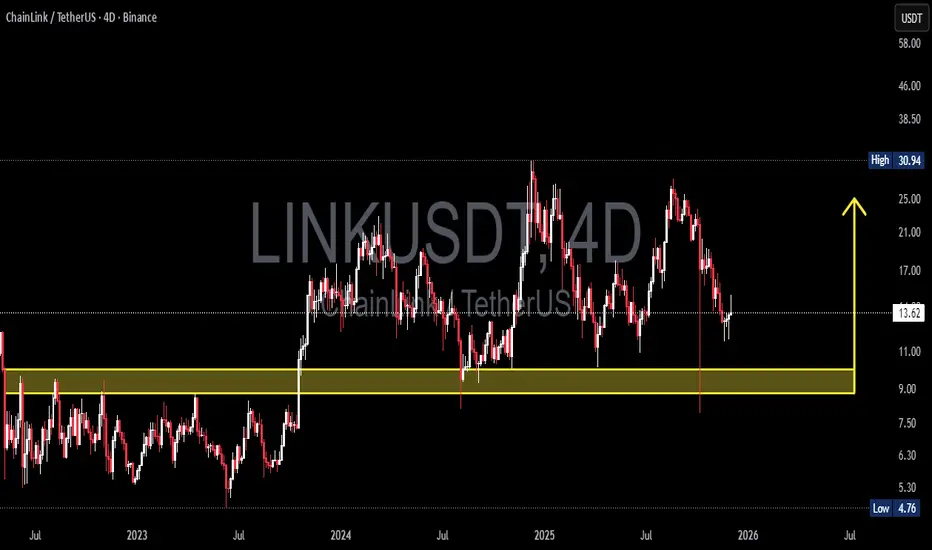
LINK is now approaching the most critical level of its multi-year market structure. The price has returned to the exact same demand block that triggered the major bullish expansion in previous cycles. This isn’t just support — it’s a historical liquidity zone where smart money repeatedly positioned itself before every significant rally.
And once again, the market is testing this area.
---
**✨ Market Narrative:
“Back to Where the Trend Began”**
From 2023 to 2025, every approach to the $10–$8.8 zone resulted in heavy absorption, long wicks, and strong reversals. This proves that this area acts as a primary liquidity pool for institutional accumulation.
This current revisit could become:
A bullish revival into a new multi-month uptrend,
or
A full breakdown into deeper distribution if the zone fails.
Simply put:
👉 This is LINK’s “make or break” level.
---
📈 Bullish Scenario — “Demand Awakening”
The bullish thesis activates if price:
Holds above $10–$8.8,
Forms a new higher low,
And closes strongly above $13–$14 on the 4D timeframe.
Signs of accumulation:
Long downside wicks inside the block
Increasing volume after compression
Higher timeframe candle reclaiming previous breakdown points
If confirmed, upside targets unfold naturally:
🎯 Target 1: $15–$17
🎯 Target 2: $21–$26
🎯 Target 3: Retest of the 2024 macro highs (expansion phase)
A reclaim of $17 would signal that the macro bullish trend is re-establishing itself.
---
📉 Bearish Scenario — “Demand Collapse”
The bearish thesis confirms ONLY when price:
Prints a decisive 4D close below $8.8,
Followed by continuation (not just a liquidity wick).
If the demand block breaks, the market shifts from accumulation to full distribution.
Downside targets become likely:
🎯 Target 1: $6–$5
🎯 Target 2: $4.7 (historical low & liquidity magnet)
🎯 Target 3: Full macro range retracement
This breakdown would represent a structural trend shift on the higher timeframe.
---
📊 Pattern & Market Structure Breakdown
Historical Demand Revisit: Price has returned to the core area that defined the previous rally.
Liquidity Grab Evidence: Deep wicks below the block — classic stop hunts before accumulation.
Macro Range Structure: LINK remains inside a multi-year range, hovering at its lower boundary.
Trend Context: Lower highs formed in 2025, and now price is searching for macro direction.
This isn’t ordinary price action —
this is where accumulation and distribution collide.
#LINK #Chainlink #Crypto #Altcoins #TechnicalAnalysis #DemandZone #PriceAction #MarketStructure #SmartMoney #CryptoAnalysis #SupportResistance
And once again, the market is testing this area.
---
**✨ Market Narrative:
“Back to Where the Trend Began”**
From 2023 to 2025, every approach to the $10–$8.8 zone resulted in heavy absorption, long wicks, and strong reversals. This proves that this area acts as a primary liquidity pool for institutional accumulation.
This current revisit could become:
A bullish revival into a new multi-month uptrend,
or
A full breakdown into deeper distribution if the zone fails.
Simply put:
👉 This is LINK’s “make or break” level.
---
📈 Bullish Scenario — “Demand Awakening”
The bullish thesis activates if price:
Holds above $10–$8.8,
Forms a new higher low,
And closes strongly above $13–$14 on the 4D timeframe.
Signs of accumulation:
Long downside wicks inside the block
Increasing volume after compression
Higher timeframe candle reclaiming previous breakdown points
If confirmed, upside targets unfold naturally:
🎯 Target 1: $15–$17
🎯 Target 2: $21–$26
🎯 Target 3: Retest of the 2024 macro highs (expansion phase)
A reclaim of $17 would signal that the macro bullish trend is re-establishing itself.
---
📉 Bearish Scenario — “Demand Collapse”
The bearish thesis confirms ONLY when price:
Prints a decisive 4D close below $8.8,
Followed by continuation (not just a liquidity wick).
If the demand block breaks, the market shifts from accumulation to full distribution.
Downside targets become likely:
🎯 Target 1: $6–$5
🎯 Target 2: $4.7 (historical low & liquidity magnet)
🎯 Target 3: Full macro range retracement
This breakdown would represent a structural trend shift on the higher timeframe.
---
📊 Pattern & Market Structure Breakdown
Historical Demand Revisit: Price has returned to the core area that defined the previous rally.
Liquidity Grab Evidence: Deep wicks below the block — classic stop hunts before accumulation.
Macro Range Structure: LINK remains inside a multi-year range, hovering at its lower boundary.
Trend Context: Lower highs formed in 2025, and now price is searching for macro direction.
This isn’t ordinary price action —
this is where accumulation and distribution collide.
#LINK #Chainlink #Crypto #Altcoins #TechnicalAnalysis #DemandZone #PriceAction #MarketStructure #SmartMoney #CryptoAnalysis #SupportResistance

✅ Get Free Signals! Join Our Telegram Channel Here: t.me/TheCryptoNuclear
✅ Twitter: twitter.com/crypto_nuclear
✅ Join Bybit : partner.bybit.com/b/nuclearvip
✅ Benefits : Lifetime Trading Fee Discount -50%
✅ Twitter: twitter.com/crypto_nuclear
✅ Join Bybit : partner.bybit.com/b/nuclearvip
✅ Benefits : Lifetime Trading Fee Discount -50%
Aviso legal
As informações e publicações não se destinam a ser, e não constituem, conselhos ou recomendações financeiras, de investimento, comerciais ou de outro tipo fornecidos ou endossados pela TradingView. Leia mais nos Termos de Uso.
✅ Get Free Signals! Join Our Telegram Channel Here: t.me/TheCryptoNuclear
✅ Twitter: twitter.com/crypto_nuclear
✅ Join Bybit : partner.bybit.com/b/nuclearvip
✅ Benefits : Lifetime Trading Fee Discount -50%
✅ Twitter: twitter.com/crypto_nuclear
✅ Join Bybit : partner.bybit.com/b/nuclearvip
✅ Benefits : Lifetime Trading Fee Discount -50%
Aviso legal
As informações e publicações não se destinam a ser, e não constituem, conselhos ou recomendações financeiras, de investimento, comerciais ou de outro tipo fornecidos ou endossados pela TradingView. Leia mais nos Termos de Uso.