
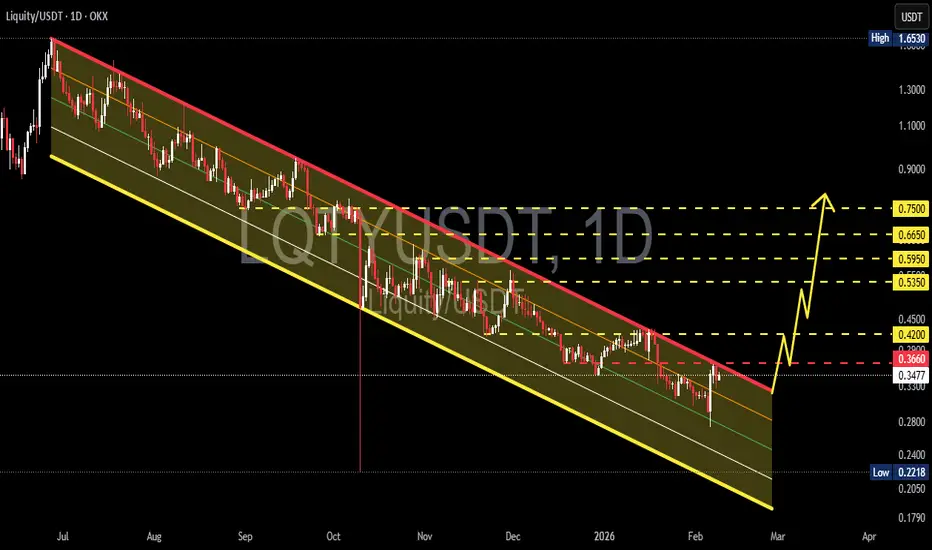
On the 1D timeframe, LQTY/USDT remains in a well-defined mid-term downtrend structure. Price has been moving consistently inside a descending parallel channel since the mid-2025 peak.
The formation of lower highs and lower lows is still intact, indicating sellers remain in control. However, price is now approaching the upper channel resistance, opening the possibility of a transition phase — either a breakout reversal or another continuation rejection.
---
Pattern Explanation
Descending Parallel Channel
The main pattern on this chart is a descending channel characterized by:
Upper trendline (red) → Dynamic resistance
Lower trendline (yellow) → Dynamic support
Midline → Reaction / equilibrium zone
Pattern implications:
As long as price stays inside the channel → Trend remains bearish
A valid breakout above the channel → Reversal / trend shift signal
Rejection at the upper channel → Bearish continuation
This channel has been respected multiple times, giving it strong technical validity.
---
Key Levels
Resistance Levels
0.4200 → Minor resistance / mid reaction
0.5350 → Initial supply zone
0.5950 → Structural resistance
0.6650 → Breakout confirmation zone
0.7500 → Major resistance / distribution area
Support Levels
0.3660 → Current horizontal support
0.3467 → Recent reaction support
Channel low → Main dynamic support
0.2218 → Extreme swing low
---
Bullish Scenario
The bullish case activates if price delivers a valid breakout above the descending channel and reclaims horizontal resistance.
Potential upside path:
1. Break & close above 0.4200
2. Successful retest → Continuation
3. Rally toward 0.5350
4. Supply break → Move to 0.5950
5. Strong momentum → Test 0.6650
6. Extension target → 0.7500
Additional confirmations:
Volume expansion
Formation of higher highs above the channel
Upper channel retest holding as support
If confirmed → This could evolve into a mid-term trend reversal.
---
Bearish Scenario
If price fails to break out and gets rejected at the upper channel:
Potential bearish path:
1. Rejection around 0.4200 – 0.4500
2. Breakdown below 0.3660
3. Retest 0.3467
4. Continuation toward channel low
5. Worst case → Liquidity sweep to 0.2218
As long as price remains inside the channel → Bearish structure stays valid.
---
Conclusion
LQTY is currently sitting at a critical decision zone.
Structurally still bearish
Testing channel resistance
Breakout = Major reversal opportunity
Rejection = Downtrend continuation
The next major move will be determined by price reaction at the upper descending channel resistance.
#LQTY #LQTYUSDT #Liquity #CryptoAnalysis #AltcoinAnalysis #TechnicalAnalysis #DescendingChannel #BreakoutSetup #CryptoTrading #Altcoins #ChartPattern #SupportResistance #TrendReversal #CryptoMarket
The formation of lower highs and lower lows is still intact, indicating sellers remain in control. However, price is now approaching the upper channel resistance, opening the possibility of a transition phase — either a breakout reversal or another continuation rejection.
---
Pattern Explanation
Descending Parallel Channel
The main pattern on this chart is a descending channel characterized by:
Upper trendline (red) → Dynamic resistance
Lower trendline (yellow) → Dynamic support
Midline → Reaction / equilibrium zone
Pattern implications:
As long as price stays inside the channel → Trend remains bearish
A valid breakout above the channel → Reversal / trend shift signal
Rejection at the upper channel → Bearish continuation
This channel has been respected multiple times, giving it strong technical validity.
---
Key Levels
Resistance Levels
0.4200 → Minor resistance / mid reaction
0.5350 → Initial supply zone
0.5950 → Structural resistance
0.6650 → Breakout confirmation zone
0.7500 → Major resistance / distribution area
Support Levels
0.3660 → Current horizontal support
0.3467 → Recent reaction support
Channel low → Main dynamic support
0.2218 → Extreme swing low
---
Bullish Scenario
The bullish case activates if price delivers a valid breakout above the descending channel and reclaims horizontal resistance.
Potential upside path:
1. Break & close above 0.4200
2. Successful retest → Continuation
3. Rally toward 0.5350
4. Supply break → Move to 0.5950
5. Strong momentum → Test 0.6650
6. Extension target → 0.7500
Additional confirmations:
Volume expansion
Formation of higher highs above the channel
Upper channel retest holding as support
If confirmed → This could evolve into a mid-term trend reversal.
---
Bearish Scenario
If price fails to break out and gets rejected at the upper channel:
Potential bearish path:
1. Rejection around 0.4200 – 0.4500
2. Breakdown below 0.3660
3. Retest 0.3467
4. Continuation toward channel low
5. Worst case → Liquidity sweep to 0.2218
As long as price remains inside the channel → Bearish structure stays valid.
---
Conclusion
LQTY is currently sitting at a critical decision zone.
Structurally still bearish
Testing channel resistance
Breakout = Major reversal opportunity
Rejection = Downtrend continuation
The next major move will be determined by price reaction at the upper descending channel resistance.
#LQTY #LQTYUSDT #Liquity #CryptoAnalysis #AltcoinAnalysis #TechnicalAnalysis #DescendingChannel #BreakoutSetup #CryptoTrading #Altcoins #ChartPattern #SupportResistance #TrendReversal #CryptoMarket

✅ Get Free Signals! Join Our Telegram Channel Here: t.me/TheCryptoNuclear
✅ Twitter: twitter.com/crypto_nuclear
✅ Join Bybit : partner.bybit.com/b/nuclearvip
✅ Benefits : Lifetime Trading Fee Discount -50%
✅ Twitter: twitter.com/crypto_nuclear
✅ Join Bybit : partner.bybit.com/b/nuclearvip
✅ Benefits : Lifetime Trading Fee Discount -50%
Aviso legal
As informações e publicações não se destinam a ser, e não constituem, conselhos ou recomendações financeiras, de investimento, comerciais ou de outro tipo fornecidos ou endossados pela TradingView. Leia mais nos Termos de Uso.
✅ Get Free Signals! Join Our Telegram Channel Here: t.me/TheCryptoNuclear
✅ Twitter: twitter.com/crypto_nuclear
✅ Join Bybit : partner.bybit.com/b/nuclearvip
✅ Benefits : Lifetime Trading Fee Discount -50%
✅ Twitter: twitter.com/crypto_nuclear
✅ Join Bybit : partner.bybit.com/b/nuclearvip
✅ Benefits : Lifetime Trading Fee Discount -50%
Aviso legal
As informações e publicações não se destinam a ser, e não constituem, conselhos ou recomendações financeiras, de investimento, comerciais ou de outro tipo fornecidos ou endossados pela TradingView. Leia mais nos Termos de Uso.