
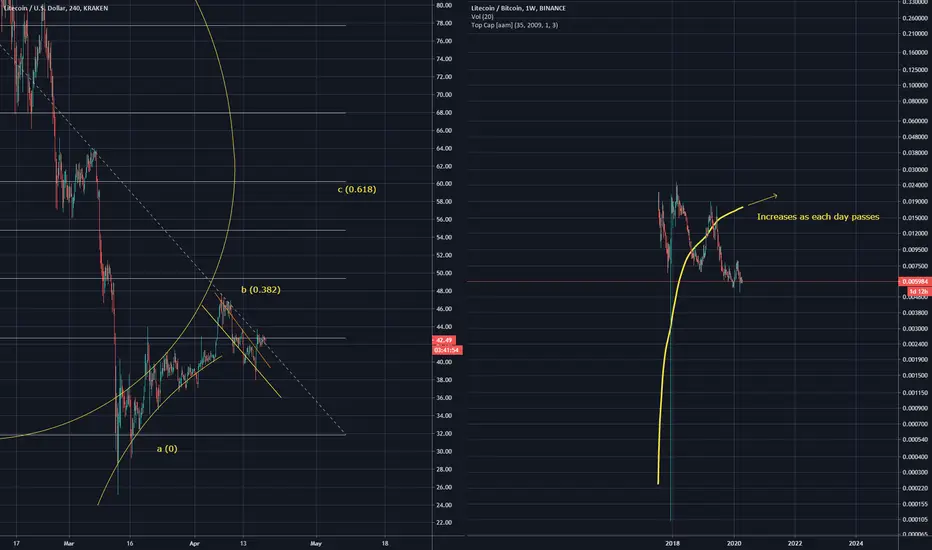
As you can see LTCUSD pair has formed an inverted ascending scallop formation against the resistance of the fibonacci spiral, broken out, formed a falling wedge and attempted to break out again. I believe this is the pullback before a larger rise, hence the C target. On the LTCBTC pair you can see the TopCap indicator showing the value of the pair at its peak, which increases as each day passes.

Aviso legal
As informações e publicações não se destinam a ser, e não constituem, conselhos ou recomendações financeiras, de investimento, comerciais ou de outro tipo fornecidos ou endossados pela TradingView. Leia mais nos Termos de Uso.
Aviso legal
As informações e publicações não se destinam a ser, e não constituem, conselhos ou recomendações financeiras, de investimento, comerciais ou de outro tipo fornecidos ou endossados pela TradingView. Leia mais nos Termos de Uso.