
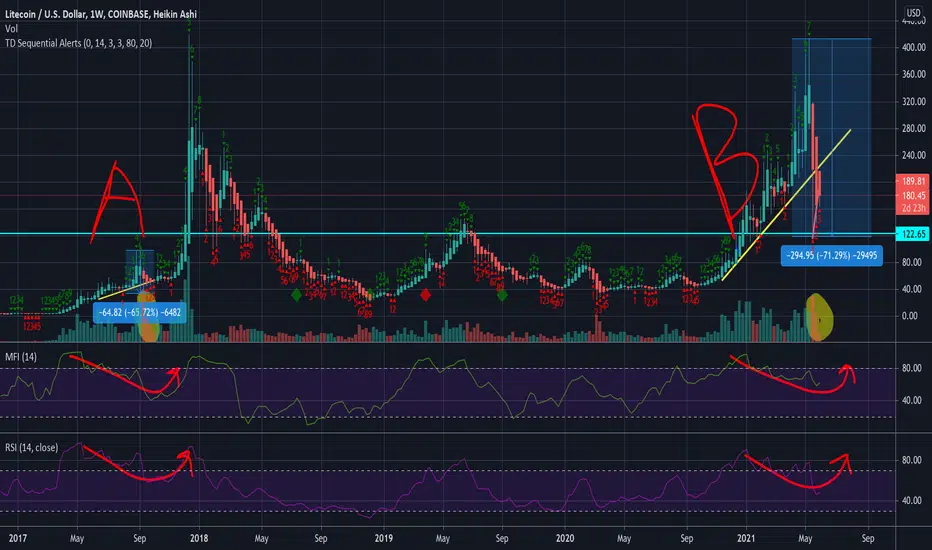
Looking at the graph A & B you see some similarities.
1.) The drop in both was close to 70%.
2.) You will also notice the volume candles highlighted in yellow. Only time in LTC weekly chart that you see that similarity in decreasing selling volume candles
3.) MFI and RSI seem to be following similar patterns to the 2017 crash.
IF I had to take a calculated guess I would expect a new all time high within the next couple of months depending on the overall health of the financial markets.
1.) The drop in both was close to 70%.
2.) You will also notice the volume candles highlighted in yellow. Only time in LTC weekly chart that you see that similarity in decreasing selling volume candles
3.) MFI and RSI seem to be following similar patterns to the 2017 crash.
IF I had to take a calculated guess I would expect a new all time high within the next couple of months depending on the overall health of the financial markets.

Aviso legal
As informações e publicações não se destinam a ser, e não constituem, conselhos ou recomendações financeiras, de investimento, comerciais ou de outro tipo fornecidos ou endossados pela TradingView. Leia mais nos Termos de Uso.
Aviso legal
As informações e publicações não se destinam a ser, e não constituem, conselhos ou recomendações financeiras, de investimento, comerciais ou de outro tipo fornecidos ou endossados pela TradingView. Leia mais nos Termos de Uso.