
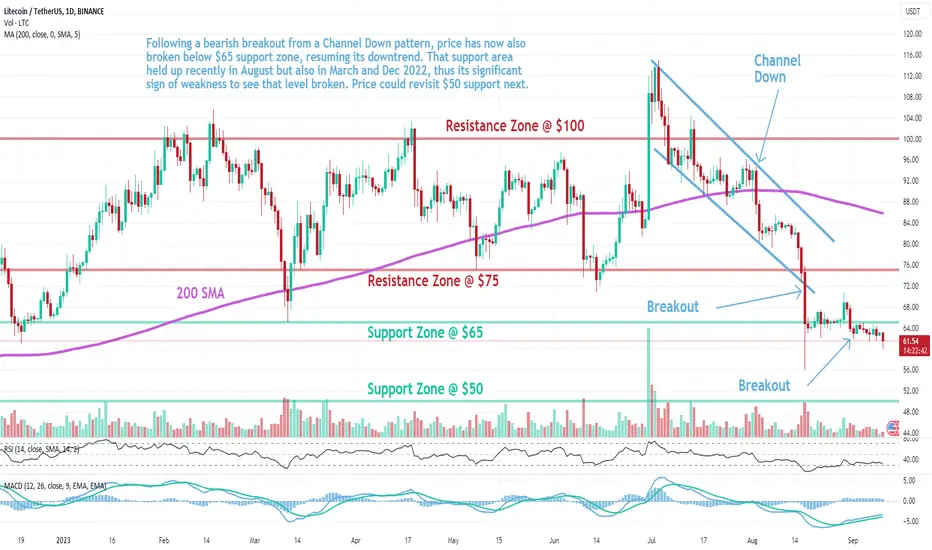
Litecoin (LTC) technical analysis:
Trade setup: Following a bearish breakout from a Channel Down pattern, price has now also broken below $65 support zone, resuming its downtrend. That support area held up recently in August but also in March and Dec 2022, thus its significant sign of weakness to see that level broken. Price could revisit $50 support next.
Trend: Downtrend across all time horizons (Short- Medium- and Long-Term).
Momentum is Mixed as MACD Line is above MACD Signal Line (Bullish) but RSI < 45 (Bearish).
Support and Resistance: Nearest Support Zone is $65, which it broke, then $50. The nearest Resistance Zone is $75 (previous support), then $100.

Aviso legal
As informações e publicações não se destinam a ser, e não constituem, conselhos ou recomendações financeiras, de investimento, comerciais ou de outro tipo fornecidos ou endossados pela TradingView. Leia mais nos Termos de Uso.
Aviso legal
As informações e publicações não se destinam a ser, e não constituem, conselhos ou recomendações financeiras, de investimento, comerciais ou de outro tipo fornecidos ou endossados pela TradingView. Leia mais nos Termos de Uso.