Long
LTO Bullish
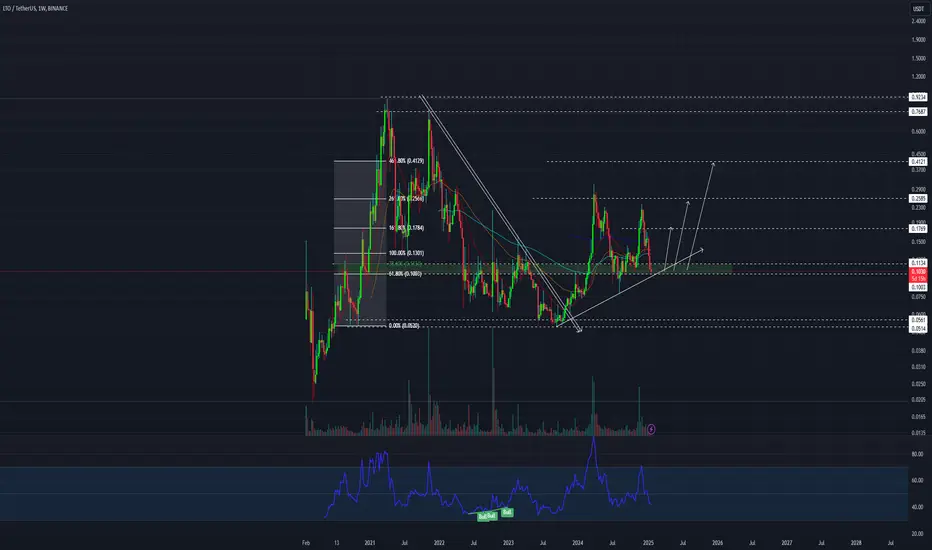
LTO-USDT is showing strong bullish signals, supported by several key technical indicators. The price has successfully retested the weekly resistance level, coinciding with the 61.8% Fibo
which is a critical area for confirming bullish momentum.
This retest was accompanied by a significantly high trading volume compared to the previous period, similar to the volume spikes observed during previous breakout waves, indicating strong Zone.
Additionally, LTO-USDT has breached a major downtrend line, further solidifying the bullish reversal.
On the 4-hour chart, a falling wedge pattern has been identified, which is typically a bullish continuation pattern. This combination of factors—retesting key resistance, high volume, breakout of a downtrend, and a falling wedge—suggests a strong potential for upward movement in LTO-USDT.

Aviso legal
As informações e publicações não se destinam a ser, e não constituem, conselhos ou recomendações financeiras, de investimento, comerciais ou de outro tipo fornecidos ou endossados pela TradingView. Leia mais nos Termos de Uso.
Aviso legal
As informações e publicações não se destinam a ser, e não constituem, conselhos ou recomendações financeiras, de investimento, comerciais ou de outro tipo fornecidos ou endossados pela TradingView. Leia mais nos Termos de Uso.