
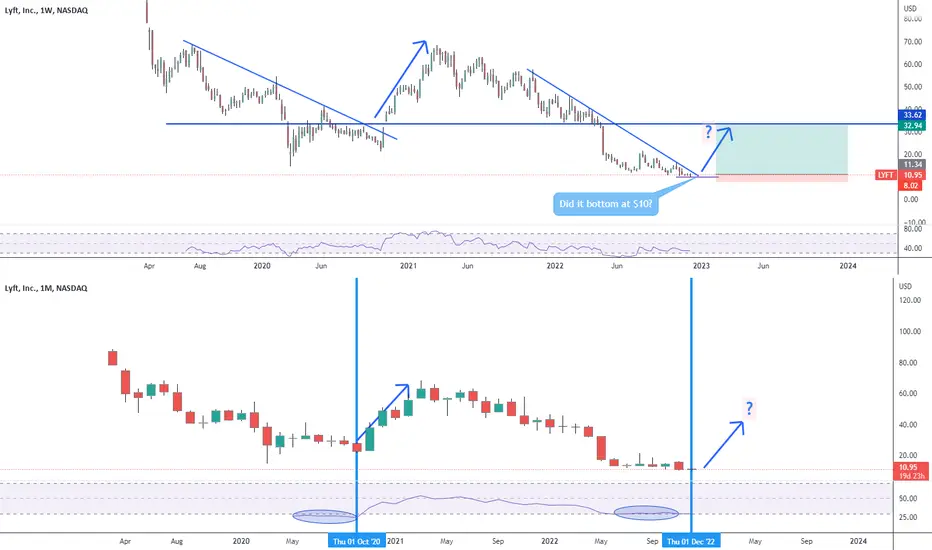
Top chart weekly, bottom chart monthly. See the pattern? The monthly timeframe shows the price has been trading in oversold territory for 5 months, last time that happened the price blew up. I'm opening a small long position on Monday if a see the price trying to break the resistance I'll add.
Trade ativo
Just added. The $11.50 support level is holding wellTrade ativo
Well, the $10 is holding well. Still holding my long position. Looks like bulls are coming back.
Aviso legal
As informações e publicações não se destinam a ser, e não constituem, conselhos ou recomendações financeiras, de investimento, comerciais ou de outro tipo fornecidos ou endossados pela TradingView. Leia mais nos Termos de Uso.
Aviso legal
As informações e publicações não se destinam a ser, e não constituem, conselhos ou recomendações financeiras, de investimento, comerciais ou de outro tipo fornecidos ou endossados pela TradingView. Leia mais nos Termos de Uso.