
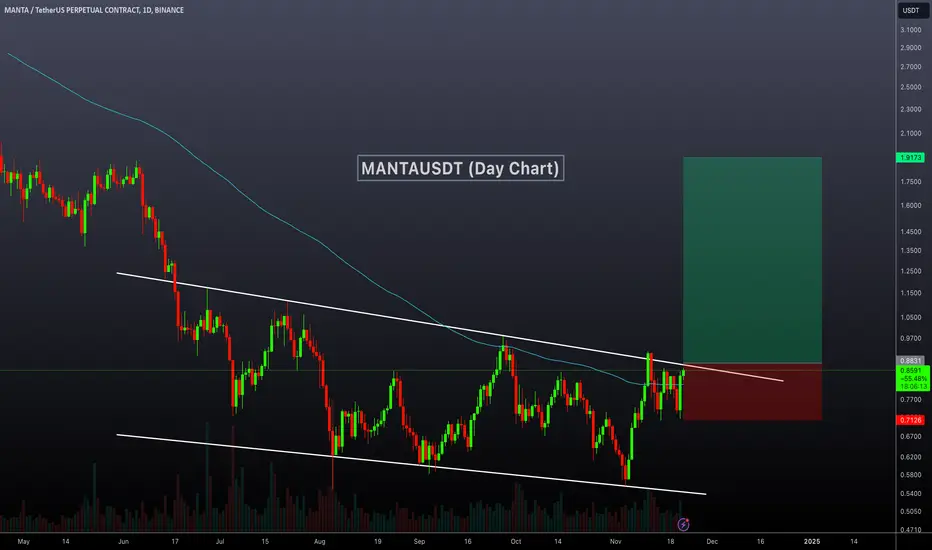
MANTAUSDT Technical analsysis update
MANTA has been trading within a descending channel for the past 150 days. The price now moves toward the channel's resistance, signaling a potential breakout. Currently, the daily chart shows that the price is trading above 100 EMA. Once a breakout occurs, a strong bullish move can be expected.
Buy zone : Below $0.88
Stop loss : $0.715
Regards
Hexa
MANTA has been trading within a descending channel for the past 150 days. The price now moves toward the channel's resistance, signaling a potential breakout. Currently, the daily chart shows that the price is trading above 100 EMA. Once a breakout occurs, a strong bullish move can be expected.
Buy zone : Below $0.88
Stop loss : $0.715
Regards
Hexa

🚀Telegram : t.me/hexatrades
🌐Website: hexatrades.io/
🗣️Twitter(X): twitter.com/HexaTrades
🌐Website: hexatrades.io/
🗣️Twitter(X): twitter.com/HexaTrades
Publicações relacionadas
Aviso legal
As informações e publicações não se destinam a ser, e não constituem, conselhos ou recomendações financeiras, de investimento, comerciais ou de outro tipo fornecidos ou endossados pela TradingView. Leia mais nos Termos de Uso.
🚀Telegram : t.me/hexatrades
🌐Website: hexatrades.io/
🗣️Twitter(X): twitter.com/HexaTrades
🌐Website: hexatrades.io/
🗣️Twitter(X): twitter.com/HexaTrades
Publicações relacionadas
Aviso legal
As informações e publicações não se destinam a ser, e não constituem, conselhos ou recomendações financeiras, de investimento, comerciais ou de outro tipo fornecidos ou endossados pela TradingView. Leia mais nos Termos de Uso.