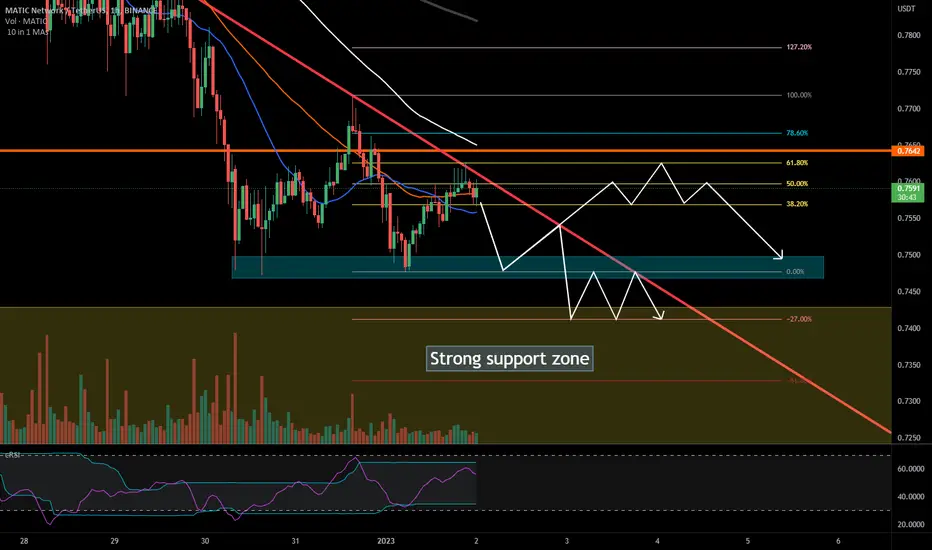
2 possible MATIC trajectories
$BINANCE:MATICUSDT
The price is near a very strong support zone . If the price bounces once again against the red trendline as shown on the chart, it is most likely to fall to the support zone drawn approximately to the -27% Fibonacci level. If the trendline is not respected and a strong bullish candle closes above the red trendline, it is most likely that the price will rise to the 61.8% Fibonacci level, coinciding approximately with a previous high.
The price is near a very strong support zone . If the price bounces once again against the red trendline as shown on the chart, it is most likely to fall to the support zone drawn approximately to the -27% Fibonacci level. If the trendline is not respected and a strong bullish candle closes above the red trendline, it is most likely that the price will rise to the 61.8% Fibonacci level, coinciding approximately with a previous high.

Aviso legal
As informações e publicações não se destinam a ser, e não constituem, conselhos ou recomendações financeiras, de investimento, comerciais ou de outro tipo fornecidos ou endossados pela TradingView. Leia mais nos Termos de Uso.
Aviso legal
As informações e publicações não se destinam a ser, e não constituem, conselhos ou recomendações financeiras, de investimento, comerciais ou de outro tipo fornecidos ou endossados pela TradingView. Leia mais nos Termos de Uso.