Long
MATIC: Approaching Resistance
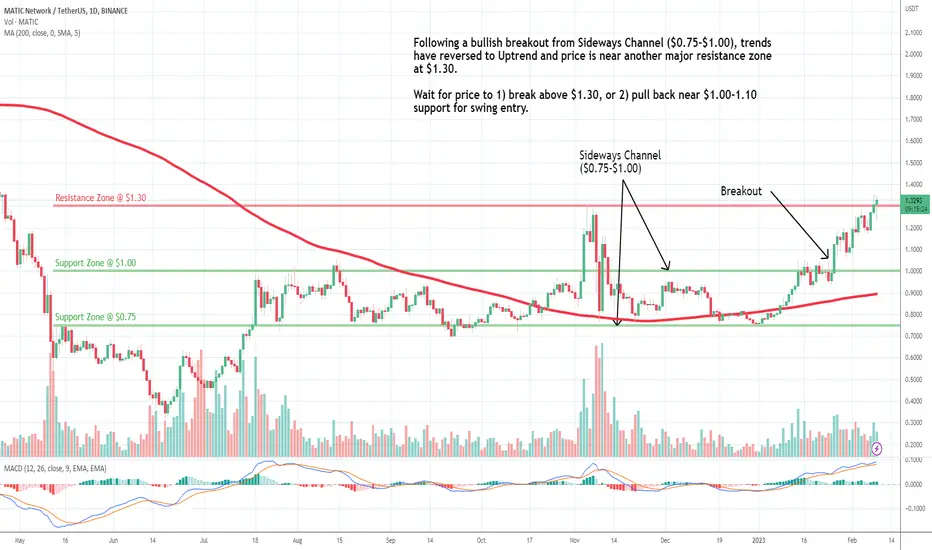
Polygon (MATIC) technical analysis:
Trade setup: Following a bullish breakout from Sideways Channel ($0.75-$1.00), trends have reversed to Uptrend and price is near another major resistance zone at $1.30. wait for price to 1) break above $1.30, or 2) pull back near $1.00-1.10 support for swing entry.
Trend: Uptrend across all time horizons (Short- Medium- and Long-Term).
Momentum is Bullish but inflecting. MACD Line is above MACD Signal Line and RSI is above 55 but momentum may have peaked since MACD Histogram bars are declining, which suggests that momentum is weakening.
Support and Resistance: Nearest Support Zone is $1.00 (previous resistance), then $0.75. The nearest Resistance Zone is $1.30.
Trade setup: Following a bullish breakout from Sideways Channel ($0.75-$1.00), trends have reversed to Uptrend and price is near another major resistance zone at $1.30. wait for price to 1) break above $1.30, or 2) pull back near $1.00-1.10 support for swing entry.
Trend: Uptrend across all time horizons (Short- Medium- and Long-Term).
Momentum is Bullish but inflecting. MACD Line is above MACD Signal Line and RSI is above 55 but momentum may have peaked since MACD Histogram bars are declining, which suggests that momentum is weakening.
Support and Resistance: Nearest Support Zone is $1.00 (previous resistance), then $0.75. The nearest Resistance Zone is $1.30.

Aviso legal
As informações e publicações não se destinam a ser, e não constituem, conselhos ou recomendações financeiras, de investimento, comerciais ou de outro tipo fornecidos ou endossados pela TradingView. Leia mais nos Termos de Uso.
Aviso legal
As informações e publicações não se destinam a ser, e não constituem, conselhos ou recomendações financeiras, de investimento, comerciais ou de outro tipo fornecidos ou endossados pela TradingView. Leia mais nos Termos de Uso.