
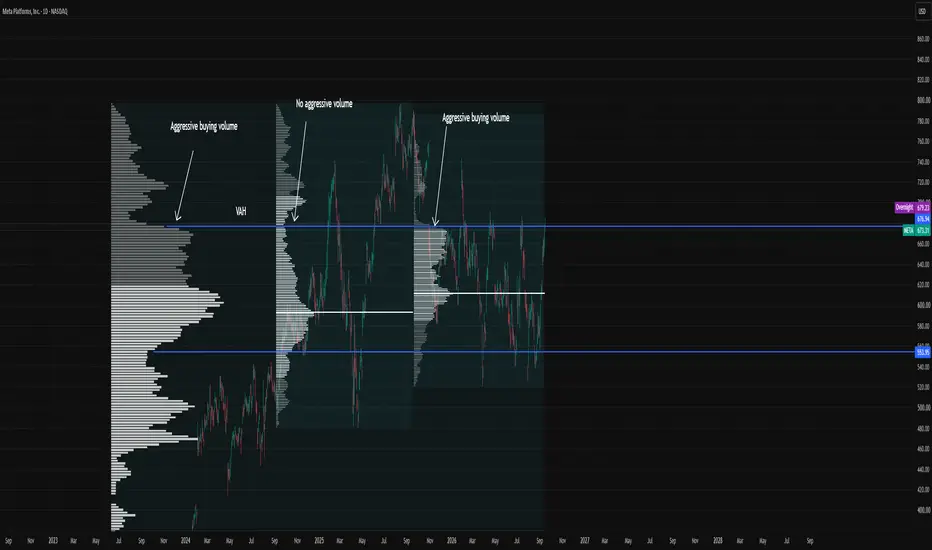
The analysis shows three volume profiles:
The first profile, on the far left, covers the entire period from July 2023 to the present.
The second covers the period from July 2024 to the all-time high (ATH).
The third covers the period from the ATH to the present.
In the first and largest volume profile, we can see that the price is currently trading within a clear high-volume node. By studying the third profile, we can determine when this volume was built. Since it developed relatively recently, it suggests that aggressive sellers have been active around the current level. This increases my interest in looking for a potential short setup.
The analysis is based on the 70% rule. The price has already moved approximately 70% through the balanced area and could therefore rotate back into the balance, where the market has found acceptance since September 2025.
If I see clear absorption on a lower timeframe, such as the 10- or 15-minute chart, followed by sellers regaining control and beginning to push the price lower, I may consider entering a short position.
Could the price break above USD 676 and continue higher? Absolutely. There is never any guarantee that a level will hold simply because it has done so in the past. However, the area is becoming increasingly interesting from a risk-to-reward perspective for anyone looking for a potential short entry.
The first profile, on the far left, covers the entire period from July 2023 to the present.
The second covers the period from July 2024 to the all-time high (ATH).
The third covers the period from the ATH to the present.
In the first and largest volume profile, we can see that the price is currently trading within a clear high-volume node. By studying the third profile, we can determine when this volume was built. Since it developed relatively recently, it suggests that aggressive sellers have been active around the current level. This increases my interest in looking for a potential short setup.
The analysis is based on the 70% rule. The price has already moved approximately 70% through the balanced area and could therefore rotate back into the balance, where the market has found acceptance since September 2025.
If I see clear absorption on a lower timeframe, such as the 10- or 15-minute chart, followed by sellers regaining control and beginning to push the price lower, I may consider entering a short position.
Could the price break above USD 676 and continue higher? Absolutely. There is never any guarantee that a level will hold simply because it has done so in the past. However, the area is becoming increasingly interesting from a risk-to-reward perspective for anyone looking for a potential short entry.

Aviso legal
As informações e publicações não se destinam a ser, e não constituem, conselhos ou recomendações financeiras, de investimento, comerciais ou de outro tipo fornecidos ou endossados pela TradingView. Leia mais nos Termos de Uso.
Aviso legal
As informações e publicações não se destinam a ser, e não constituem, conselhos ou recomendações financeiras, de investimento, comerciais ou de outro tipo fornecidos ou endossados pela TradingView. Leia mais nos Termos de Uso.