
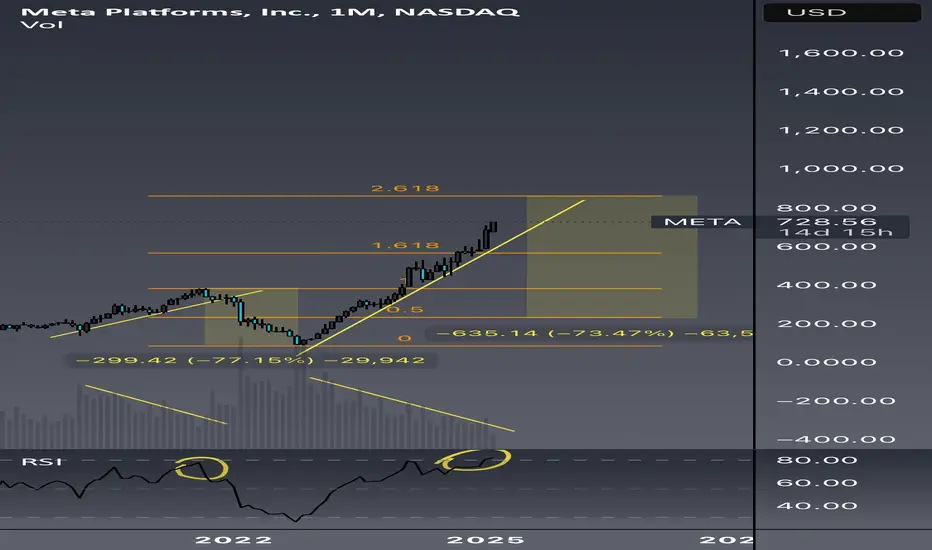
Just a little fun and brainstorming with higher time frame charts. Utilizing RSI, patterns, and time cycles.
Lots of similarities between now and the 2020-2021 bull run. Not to mention a lot of good data suggesting we are close to a recession at best. (Weak housing data/stocks, yield curve uninversion)
What are your thoughts?
Lots of similarities between now and the 2020-2021 bull run. Not to mention a lot of good data suggesting we are close to a recession at best. (Weak housing data/stocks, yield curve uninversion)
What are your thoughts?

Aviso legal
As informações e publicações não se destinam a ser, e não constituem, conselhos ou recomendações financeiras, de investimento, comerciais ou de outro tipo fornecidos ou endossados pela TradingView. Leia mais nos Termos de Uso.
Aviso legal
As informações e publicações não se destinam a ser, e não constituem, conselhos ou recomendações financeiras, de investimento, comerciais ou de outro tipo fornecidos ou endossados pela TradingView. Leia mais nos Termos de Uso.