
META IS TRENDING AFTER THE NEW VR GLASSES ANNOUNCEMENT — BUT THE MFTC CHART WAS ALREADY SHOWING SOMETHING INTERESTING. 👀
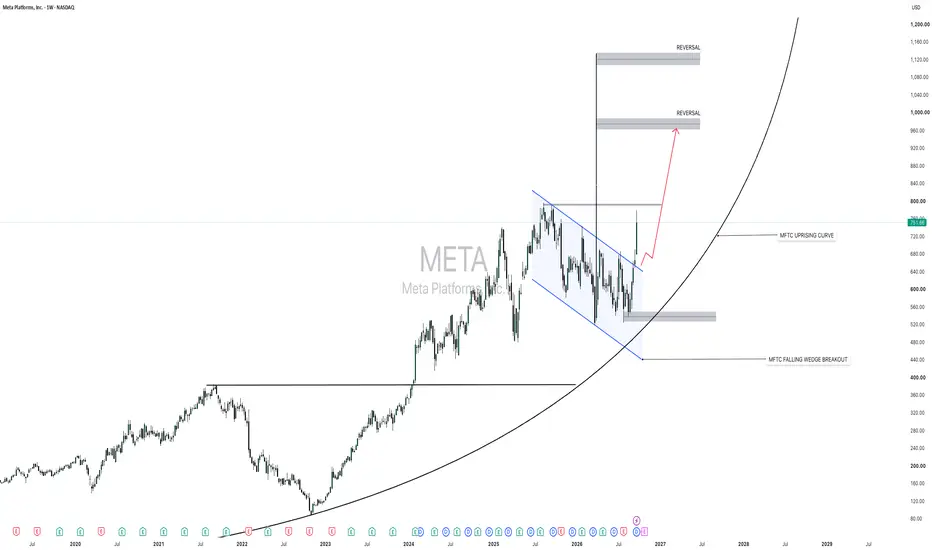
META is showing a potentially significant MFTC bullish structure on the Weekly chart, with the price breaking out of a long-term Falling Wedge.
The larger-timeframe structure remains constructive, with the MFTC Uprising Curve providing an additional structural reference for the projected path.
🔵 MFTC Analysis
META has developed a clear Falling Wedge structure on the Weekly timeframe. After spending an extended period consolidating inside the wedge, price has now moved above the descending structure.
According to the MFTC framework, the combination of:
Weekly Falling Wedge breakout
MFTC Uprising Curve
MFTC Reversal Areas
Monthly + Weekly structure alignment
creates a potential bullish continuation/reversal setup.
🎯 MFTC Upside Areas
The marked reversal zones on the chart are:
First potential upside area: 960–980
Second potential upside area: 1,100–1,130
These are projected structural areas from the current MFTC analysis, rather than guaranteed targets.
📉 How I Would Approach the Setup
Rather than chasing the breakout, the MFTC framework can be used to monitor pullbacks/dips toward important structural areas.
For a lower-timeframe entry, the Daily + 1H timeframe can be used for confirmation.
A bullish I.R. (Initial Reversal) formation on the 1H/Daily timeframe could provide the confirmation trigger for an upside setup.
⚠️ Invalidation / Risk
The bullish thesis should be reassessed if META loses the important lower structural support and the falling-wedge breakout fails.
The area around 530–550 is particularly important on the chart as a major structural support/retest region.
🔥 MFTC View
META — Falling Wedge Breakout + MFTC Uprising Curve + Reversal Areas
The bigger-picture structure suggests that META could remain in a bullish structural phase, with pullbacks potentially becoming areas to watch for fresh bullish confirmation.
MFTC = Market Footprinting Trading Concept
This is a technical analysis/educational idea, not a guarantee of future price movement or a recommendation to buy or sell. Always manage risk and perform your own analysis.
Tags:
#META #MetaPlatforms #Facebook #MFTC #MarketFootprinting #TechnicalAnalysis #FallingWedge #StockMarket #NASDAQ #USStocks #TradingView #PriceAction #SwingTrading #Trading #Investing
META is showing a potentially significant MFTC bullish structure on the Weekly chart, with the price breaking out of a long-term Falling Wedge.
The larger-timeframe structure remains constructive, with the MFTC Uprising Curve providing an additional structural reference for the projected path.
🔵 MFTC Analysis
META has developed a clear Falling Wedge structure on the Weekly timeframe. After spending an extended period consolidating inside the wedge, price has now moved above the descending structure.
According to the MFTC framework, the combination of:
Weekly Falling Wedge breakout
MFTC Uprising Curve
MFTC Reversal Areas
Monthly + Weekly structure alignment
creates a potential bullish continuation/reversal setup.
🎯 MFTC Upside Areas
The marked reversal zones on the chart are:
First potential upside area: 960–980
Second potential upside area: 1,100–1,130
These are projected structural areas from the current MFTC analysis, rather than guaranteed targets.
📉 How I Would Approach the Setup
Rather than chasing the breakout, the MFTC framework can be used to monitor pullbacks/dips toward important structural areas.
For a lower-timeframe entry, the Daily + 1H timeframe can be used for confirmation.
A bullish I.R. (Initial Reversal) formation on the 1H/Daily timeframe could provide the confirmation trigger for an upside setup.
⚠️ Invalidation / Risk
The bullish thesis should be reassessed if META loses the important lower structural support and the falling-wedge breakout fails.
The area around 530–550 is particularly important on the chart as a major structural support/retest region.
🔥 MFTC View
META — Falling Wedge Breakout + MFTC Uprising Curve + Reversal Areas
The bigger-picture structure suggests that META could remain in a bullish structural phase, with pullbacks potentially becoming areas to watch for fresh bullish confirmation.
MFTC = Market Footprinting Trading Concept
This is a technical analysis/educational idea, not a guarantee of future price movement or a recommendation to buy or sell. Always manage risk and perform your own analysis.
Tags:
#META #MetaPlatforms #Facebook #MFTC #MarketFootprinting #TechnicalAnalysis #FallingWedge #StockMarket #NASDAQ #USStocks #TradingView #PriceAction #SwingTrading #Trading #Investing

Aviso legal
As informações e publicações não se destinam a ser, e não constituem, conselhos ou recomendações financeiras, de investimento, comerciais ou de outro tipo fornecidos ou endossados pela TradingView. Leia mais nos Termos de Uso.
Aviso legal
As informações e publicações não se destinam a ser, e não constituem, conselhos ou recomendações financeiras, de investimento, comerciais ou de outro tipo fornecidos ou endossados pela TradingView. Leia mais nos Termos de Uso.