
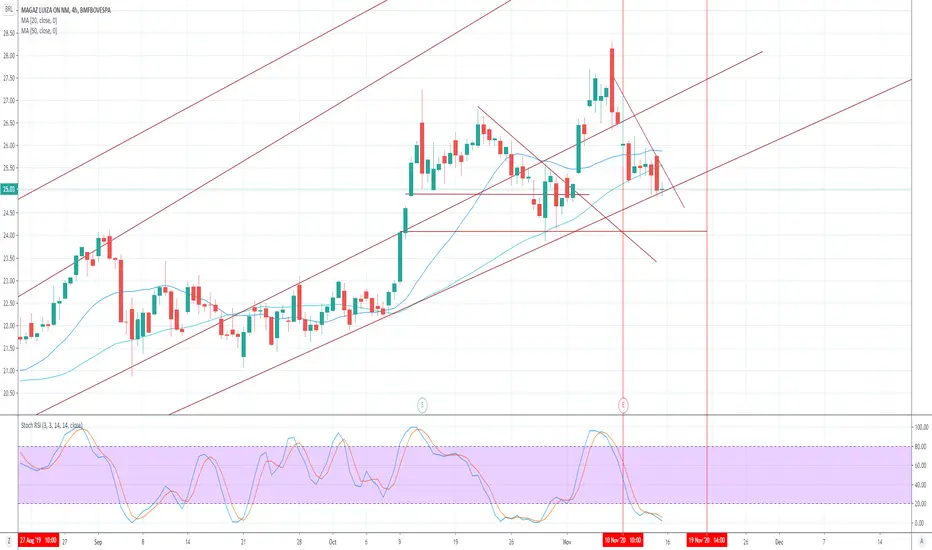
Analysing periods before, in each split you have approx 1 month down and after results 5 days down.
Analysing LTA(up trending line) and LTB(down treding line) for Long you can see down trend when the chart hit the higher line and up trend when it hits lower line.
The same is happen with RSI when the charts cross the upper line it tends to go down and when hit lower it tends to go up.
Based on that information the chart is in the transition of down trading to up trending.
Analysing LTA(up trending line) and LTB(down treding line) for Long you can see down trend when the chart hit the higher line and up trend when it hits lower line.
The same is happen with RSI when the charts cross the upper line it tends to go down and when hit lower it tends to go up.
Based on that information the chart is in the transition of down trading to up trending.

Aviso legal
As informações e publicações não se destinam a ser, e não constituem, conselhos ou recomendações financeiras, de investimento, comerciais ou de outro tipo fornecidos ou endossados pela TradingView. Leia mais nos Termos de Uso.
Aviso legal
As informações e publicações não se destinam a ser, e não constituem, conselhos ou recomendações financeiras, de investimento, comerciais ou de outro tipo fornecidos ou endossados pela TradingView. Leia mais nos Termos de Uso.