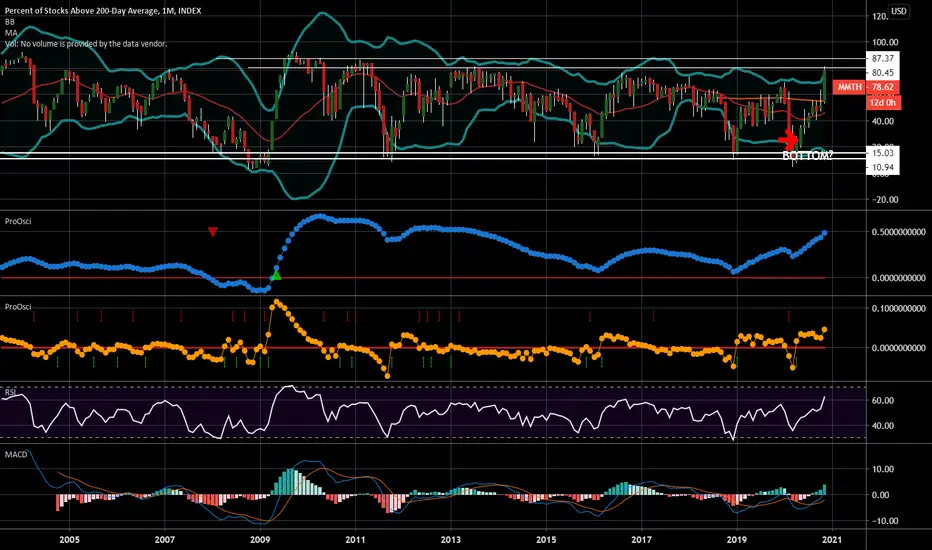
This chart is the monthly chart of % of stocks above their 200 Day Moving Average and when it gets to these levels the market will reverse direction. Greed is at extreme and the RISK greatly outweighs the potential return on a portfolio. Now would be the time to tighten up stop losses, reduce positions or outright sell positions as the market is vulnerable to bad news and could collapse quickly.

Aviso legal
As informações e publicações não se destinam a ser, e não constituem, conselhos ou recomendações financeiras, de investimento, comerciais ou de outro tipo fornecidos ou endossados pela TradingView. Leia mais nos Termos de Uso.
Aviso legal
As informações e publicações não se destinam a ser, e não constituem, conselhos ou recomendações financeiras, de investimento, comerciais ou de outro tipo fornecidos ou endossados pela TradingView. Leia mais nos Termos de Uso.