
Should Microsoft stock once again be considered in a DCA zone, after having corrected on the stock market since last November and now being the most expensive (in valuation terms) among the Magnificent 7 stocks?
This is the question I will address in this new analysis on TradingView. Feel free to follow the Swissquote account to be notified of our upcoming analyses on U.S. tech star stocks.
Here are the dominant technical and fundamental factors of our analysis:
• Microsoft shares have corrected by more than 25% since their all-time high reached in 2025, moving against the trend of the other Magnificent 7 stocks
• A major technical support is now close to the current price levels, located between $350 and $400
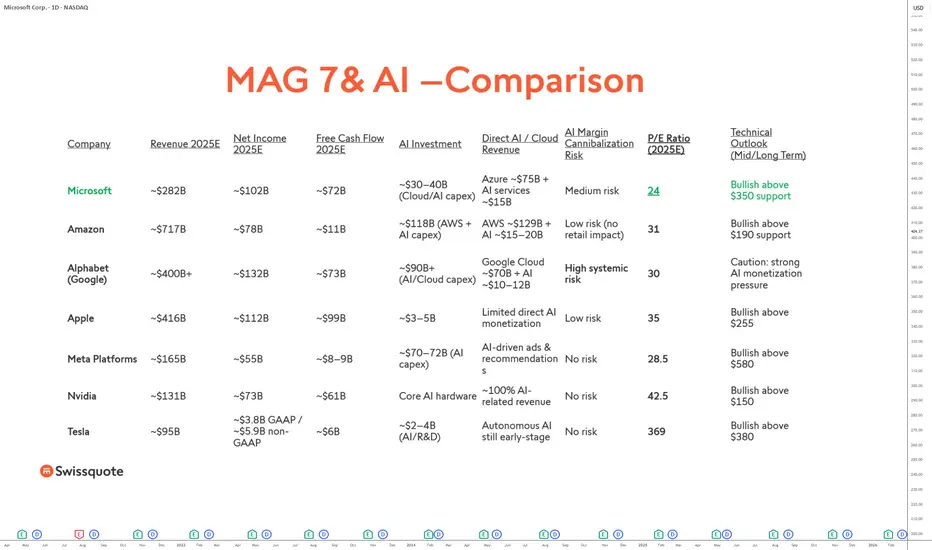
• From a fundamental perspective, Microsoft now has the highest P/E ratio among the Magnificent 7, suggesting potential catch-up opportunities, notably versus Apple and Alphabet (Google)
• Within the software sector, Microsoft has one of the lowest forward P/E ratios
It therefore appears that Microsoft stock is once again becoming an opportunity in the equity market compared to other U.S. tech leaders, provided that the S&P 500 is able to maintain its underlying bullish trend.
The chart below shows weekly Japanese candlesticks for Microsoft stock:

From a technical standpoint, the $350–$400 zone corresponds to a former long-term support that served as the base for several bullish acceleration phases during previous cycles. This area is also reinforced by major Fibonacci retracement levels as well as a high concentration of historical trading volumes. As long as prices remain above this zone, the long-term bullish structure remains intact, despite the significant correction observed since the 2025 peak.
From a fundamental perspective, the recent correction has allowed Microsoft’s valuation to normalize. With a 2025E P/E close to 24 and a forward P/E of around 23.9, the stock now appears cheaper than the majority of major U.S. software companies, while maintaining revenue and cash-flow quality well above the sector average. This is particularly notable given that Microsoft remains one of the best-positioned players in monetizing AI through Azure, cloud services, and the integration of generative AI into its legacy software.
The table below compares market valuations using forward P/E ratios for leading U.S. software companies:

Compared with the other Magnificent 7 stocks, Microsoft currently displays a more reasonable valuation than Nvidia or Tesla, while offering better visibility on cash flows than players such as Amazon. This combination of financial strength, technological leadership, and a valuation that has become attractive again supports the hypothesis of a progressive DCA zone for long-term investors.

In conclusion, as long as the S&P 500 maintains its underlying bullish momentum and the key $350–$400 support holds, Microsoft stock appears to offer a risk/reward profile that has become favorable again, particularly for a time-phased investment strategy.
DISCLAIMER:
This content is intended for individuals who are familiar with financial markets and instruments and is for information purposes only. The presented idea (including market commentary, market data and observations) is not a work product of any research department of Swissquote or its affiliates. This material is intended to highlight market action and does not constitute investment, legal or tax advice. If you are a retail investor or lack experience in trading complex financial products, it is advisable to seek professional advice from licensed advisor before making any financial decisions.
This content is not intended to manipulate the market or encourage any specific financial behavior.
Swissquote makes no representation or warranty as to the quality, completeness, accuracy, comprehensiveness or non-infringement of such content. The views expressed are those of the consultant and are provided for educational purposes only. Any information provided relating to a product or market should not be construed as recommending an investment strategy or transaction. Past performance is not a guarantee of future results.
Swissquote and its employees and representatives shall in no event be held liable for any damages or losses arising directly or indirectly from decisions made on the basis of this content.
The use of any third-party brands or trademarks is for information only and does not imply endorsement by Swissquote, or that the trademark owner has authorised Swissquote to promote its products or services.
Swissquote is the marketing brand for the activities of Swissquote Bank Ltd (Switzerland) regulated by FINMA, Swissquote Capital Markets Limited regulated by CySEC (Cyprus), Swissquote Bank Europe SA (Luxembourg) regulated by the CSSF, Swissquote Ltd (UK) regulated by the FCA, Swissquote Financial Services (Malta) Ltd regulated by the Malta Financial Services Authority, Swissquote MEA Ltd. (UAE) regulated by the Dubai Financial Services Authority, Swissquote Pte Ltd (Singapore) regulated by the Monetary Authority of Singapore, Swissquote Asia Limited (Hong Kong) licensed by the Hong Kong Securities and Futures Commission (SFC) and Swissquote South Africa (Pty) Ltd supervised by the FSCA.
Products and services of Swissquote are only intended for those permitted to receive them under local law.
All investments carry a degree of risk. The risk of loss in trading or holding financial instruments can be substantial. The value of financial instruments, including but not limited to stocks, bonds, cryptocurrencies, and other assets, can fluctuate both upwards and downwards. There is a significant risk of financial loss when buying, selling, holding, staking, or investing in these instruments. SQBE makes no recommendations regarding any specific investment, transaction, or the use of any particular investment strategy.
CFDs are complex instruments and come with a high risk of losing money rapidly due to leverage. The vast majority of retail client accounts suffer capital losses when trading in CFDs. You should consider whether you understand how CFDs work and whether you can afford to take the high risk of losing your money.
Digital Assets are unregulated in most countries and consumer protection rules may not apply. As highly volatile speculative investments, Digital Assets are not suitable for investors without a high-risk tolerance. Make sure you understand each Digital Asset before you trade.
Cryptocurrencies are not considered legal tender in some jurisdictions and are subject to regulatory uncertainties.
The use of Internet-based systems can involve high risks, including, but not limited to, fraud, cyber-attacks, network and communication failures, as well as identity theft and phishing attacks related to crypto-assets.
This is the question I will address in this new analysis on TradingView. Feel free to follow the Swissquote account to be notified of our upcoming analyses on U.S. tech star stocks.
Here are the dominant technical and fundamental factors of our analysis:
• Microsoft shares have corrected by more than 25% since their all-time high reached in 2025, moving against the trend of the other Magnificent 7 stocks
• A major technical support is now close to the current price levels, located between $350 and $400
• From a fundamental perspective, Microsoft now has the highest P/E ratio among the Magnificent 7, suggesting potential catch-up opportunities, notably versus Apple and Alphabet (Google)
• Within the software sector, Microsoft has one of the lowest forward P/E ratios
It therefore appears that Microsoft stock is once again becoming an opportunity in the equity market compared to other U.S. tech leaders, provided that the S&P 500 is able to maintain its underlying bullish trend.
The chart below shows weekly Japanese candlesticks for Microsoft stock:
From a technical standpoint, the $350–$400 zone corresponds to a former long-term support that served as the base for several bullish acceleration phases during previous cycles. This area is also reinforced by major Fibonacci retracement levels as well as a high concentration of historical trading volumes. As long as prices remain above this zone, the long-term bullish structure remains intact, despite the significant correction observed since the 2025 peak.
From a fundamental perspective, the recent correction has allowed Microsoft’s valuation to normalize. With a 2025E P/E close to 24 and a forward P/E of around 23.9, the stock now appears cheaper than the majority of major U.S. software companies, while maintaining revenue and cash-flow quality well above the sector average. This is particularly notable given that Microsoft remains one of the best-positioned players in monetizing AI through Azure, cloud services, and the integration of generative AI into its legacy software.
The table below compares market valuations using forward P/E ratios for leading U.S. software companies:
Compared with the other Magnificent 7 stocks, Microsoft currently displays a more reasonable valuation than Nvidia or Tesla, while offering better visibility on cash flows than players such as Amazon. This combination of financial strength, technological leadership, and a valuation that has become attractive again supports the hypothesis of a progressive DCA zone for long-term investors.
In conclusion, as long as the S&P 500 maintains its underlying bullish momentum and the key $350–$400 support holds, Microsoft stock appears to offer a risk/reward profile that has become favorable again, particularly for a time-phased investment strategy.
DISCLAIMER:
This content is intended for individuals who are familiar with financial markets and instruments and is for information purposes only. The presented idea (including market commentary, market data and observations) is not a work product of any research department of Swissquote or its affiliates. This material is intended to highlight market action and does not constitute investment, legal or tax advice. If you are a retail investor or lack experience in trading complex financial products, it is advisable to seek professional advice from licensed advisor before making any financial decisions.
This content is not intended to manipulate the market or encourage any specific financial behavior.
Swissquote makes no representation or warranty as to the quality, completeness, accuracy, comprehensiveness or non-infringement of such content. The views expressed are those of the consultant and are provided for educational purposes only. Any information provided relating to a product or market should not be construed as recommending an investment strategy or transaction. Past performance is not a guarantee of future results.
Swissquote and its employees and representatives shall in no event be held liable for any damages or losses arising directly or indirectly from decisions made on the basis of this content.
The use of any third-party brands or trademarks is for information only and does not imply endorsement by Swissquote, or that the trademark owner has authorised Swissquote to promote its products or services.
Swissquote is the marketing brand for the activities of Swissquote Bank Ltd (Switzerland) regulated by FINMA, Swissquote Capital Markets Limited regulated by CySEC (Cyprus), Swissquote Bank Europe SA (Luxembourg) regulated by the CSSF, Swissquote Ltd (UK) regulated by the FCA, Swissquote Financial Services (Malta) Ltd regulated by the Malta Financial Services Authority, Swissquote MEA Ltd. (UAE) regulated by the Dubai Financial Services Authority, Swissquote Pte Ltd (Singapore) regulated by the Monetary Authority of Singapore, Swissquote Asia Limited (Hong Kong) licensed by the Hong Kong Securities and Futures Commission (SFC) and Swissquote South Africa (Pty) Ltd supervised by the FSCA.
Products and services of Swissquote are only intended for those permitted to receive them under local law.
All investments carry a degree of risk. The risk of loss in trading or holding financial instruments can be substantial. The value of financial instruments, including but not limited to stocks, bonds, cryptocurrencies, and other assets, can fluctuate both upwards and downwards. There is a significant risk of financial loss when buying, selling, holding, staking, or investing in these instruments. SQBE makes no recommendations regarding any specific investment, transaction, or the use of any particular investment strategy.
CFDs are complex instruments and come with a high risk of losing money rapidly due to leverage. The vast majority of retail client accounts suffer capital losses when trading in CFDs. You should consider whether you understand how CFDs work and whether you can afford to take the high risk of losing your money.
Digital Assets are unregulated in most countries and consumer protection rules may not apply. As highly volatile speculative investments, Digital Assets are not suitable for investors without a high-risk tolerance. Make sure you understand each Digital Asset before you trade.
Cryptocurrencies are not considered legal tender in some jurisdictions and are subject to regulatory uncertainties.
The use of Internet-based systems can involve high risks, including, but not limited to, fraud, cyber-attacks, network and communication failures, as well as identity theft and phishing attacks related to crypto-assets.

This content is written by Vincent Ganne for Swissquote.
This content is intended for individuals who are familiar with financial markets and instruments and is for information purposes only and does not constitute investment, legal or tax advice.
This content is intended for individuals who are familiar with financial markets and instruments and is for information purposes only and does not constitute investment, legal or tax advice.
Aviso legal
As informações e publicações não se destinam a ser, e não constituem, conselhos ou recomendações financeiras, de investimento, comerciais ou de outro tipo fornecidos ou endossados pela TradingView. Leia mais nos Termos de Uso.
This content is written by Vincent Ganne for Swissquote.
This content is intended for individuals who are familiar with financial markets and instruments and is for information purposes only and does not constitute investment, legal or tax advice.
This content is intended for individuals who are familiar with financial markets and instruments and is for information purposes only and does not constitute investment, legal or tax advice.
Aviso legal
As informações e publicações não se destinam a ser, e não constituem, conselhos ou recomendações financeiras, de investimento, comerciais ou de outro tipo fornecidos ou endossados pela TradingView. Leia mais nos Termos de Uso.