
A pause to recent hostilities between the US and Iran may have sparked a broad relief rally across multiple asset classes on Monday, but the challenges remain for technology stocks.
Looking forward, the next directional catalyst for the Microsoft share price could be when the company reports its latest earnings on Wednesday evening after the market close.
These results come at a critical time when traders are laser focused on the huge size of AI spending by technology giants, Microsoft, Meta, Amazon and Alphabet, which is eating up their cash reserves despite the fact it may be starting to yield revenue outperformance. For example, Alphabet, the first hyperscaler to report its results last week, saw cloud computing revenue soar by 82% but its share price dropped more than 5% the following day because it also announced a larger increase to its capital expenditure forecast for 2026.
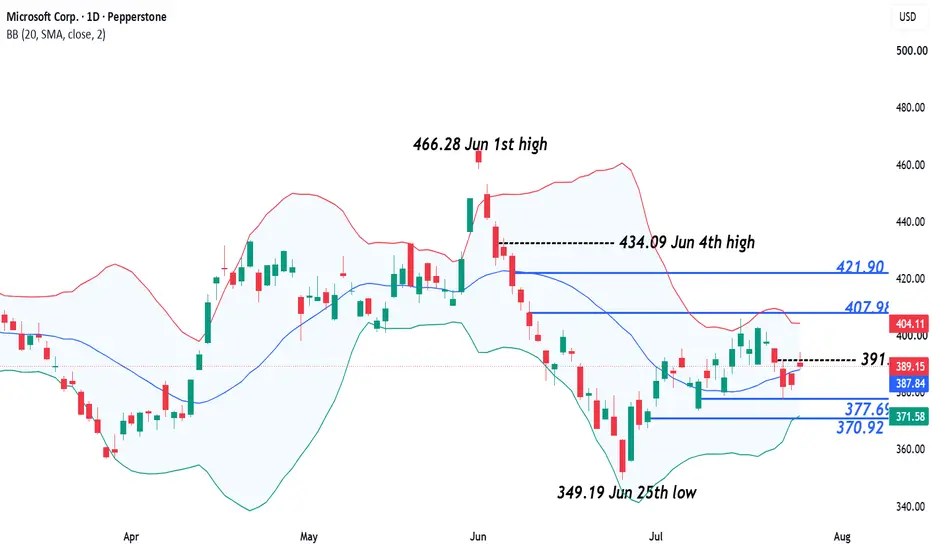
Traders may be preparing to follow a similar playbook for the Microsoft earnings on Wednesday evening, especially given the fact concerns have risen throughout 2026, that the company may be falling behind its rivals in the AI space. Since hitting a high of 466.28 at the start of June, the Microsoft share price has been under pressure, culminating in a fall to a new low for the year at 347.19 on June 25th, although it has since recovered back to current levels around 389.
When assessing this earnings release, investors may be focused on judging the revenue performance of Microsoft’s Azure cloud computing business against expectations but could also be ready to make a judgement on updates provided to capital expenditure across the rest of 2026, cash flow and future revenue projections.
Technical Update: Choppy Conditions Ahead of the Earnings Release:
As we approach the all-important Microsoft earnings on Wednesday evening, it appears as if price activity is tracing out a more balanced range, between potential resistance at the 407.98 level (50% Fibonacci retracement of the June sell-off) and potential support at the 377.69 level (50% retracement of the latest price strength).

This sideways pattern is evident in the chart above, and traders may be wondering whether the possibility of increased volatility following the earnings release could result in a closing breakout from this range, which in turn could help to indicate where the next directional themes may lie.
Potential Resistance Levels:
We have suggested that 407.98 represents the broader upper range extreme, but there is possibly an earlier resistance focus for traders at 391.93, a level equal to half of the latest price decline, which managed to cap prices on a closing basis on Monday. Closes above 391.93, while not an outright positive trigger, may lead to further price strength to test the more important 407.98 level.
If closes are seen above 407.98 this week, it could lead to continued upside momentum in price, shifting focus to 421.90 (61.8% Fibonacci retracement). A closing break above this level could then open scope towards 434.09, which is the June 4th session high.
Potential Support Levels:
While resistance at 391.93 remains intact, it’s possible that fresh price weakness may still develop. If this is the case, focus could shift toward support at 377.69, which is the 50% retracement level and the lower extreme of the current range. Closes below 377.69, may suggest a negative sentiment shift which could result in further price declines.
A closing break below 377.69 may open scope for further downside pressure toward the next support at 370.92 (61.8% retracement level). A closing break below 370.92 could expose potential for moves toward 349.19, which is the June 25th session low.
The material provided here has not been prepared accordance with legal requirements designed to promote the independence of investment research and as such is considered to be a marketing communication. Whilst it is not subject to any prohibition on dealing ahead of the dissemination of investment research, we will not seek to take any advantage before providing it to our clients.
Pepperstone doesn’t represent that the material provided here is accurate, current or complete, and therefore shouldn’t be relied upon as such. The information, whether from a third party or not, isn’t to be considered as a recommendation; or an offer to buy or sell; or the solicitation of an offer to buy or sell any security, financial product or instrument; or to participate in any particular trading strategy. It does not take into account readers’ financial situation or investment objectives. We advise any readers of this content to seek their own advice. Without the approval of Pepperstone, reproduction or redistribution of this information isn’t permitted.
Looking forward, the next directional catalyst for the Microsoft share price could be when the company reports its latest earnings on Wednesday evening after the market close.
These results come at a critical time when traders are laser focused on the huge size of AI spending by technology giants, Microsoft, Meta, Amazon and Alphabet, which is eating up their cash reserves despite the fact it may be starting to yield revenue outperformance. For example, Alphabet, the first hyperscaler to report its results last week, saw cloud computing revenue soar by 82% but its share price dropped more than 5% the following day because it also announced a larger increase to its capital expenditure forecast for 2026.
Traders may be preparing to follow a similar playbook for the Microsoft earnings on Wednesday evening, especially given the fact concerns have risen throughout 2026, that the company may be falling behind its rivals in the AI space. Since hitting a high of 466.28 at the start of June, the Microsoft share price has been under pressure, culminating in a fall to a new low for the year at 347.19 on June 25th, although it has since recovered back to current levels around 389.
When assessing this earnings release, investors may be focused on judging the revenue performance of Microsoft’s Azure cloud computing business against expectations but could also be ready to make a judgement on updates provided to capital expenditure across the rest of 2026, cash flow and future revenue projections.
Technical Update: Choppy Conditions Ahead of the Earnings Release:
As we approach the all-important Microsoft earnings on Wednesday evening, it appears as if price activity is tracing out a more balanced range, between potential resistance at the 407.98 level (50% Fibonacci retracement of the June sell-off) and potential support at the 377.69 level (50% retracement of the latest price strength).
This sideways pattern is evident in the chart above, and traders may be wondering whether the possibility of increased volatility following the earnings release could result in a closing breakout from this range, which in turn could help to indicate where the next directional themes may lie.
Potential Resistance Levels:
We have suggested that 407.98 represents the broader upper range extreme, but there is possibly an earlier resistance focus for traders at 391.93, a level equal to half of the latest price decline, which managed to cap prices on a closing basis on Monday. Closes above 391.93, while not an outright positive trigger, may lead to further price strength to test the more important 407.98 level.
If closes are seen above 407.98 this week, it could lead to continued upside momentum in price, shifting focus to 421.90 (61.8% Fibonacci retracement). A closing break above this level could then open scope towards 434.09, which is the June 4th session high.
Potential Support Levels:
While resistance at 391.93 remains intact, it’s possible that fresh price weakness may still develop. If this is the case, focus could shift toward support at 377.69, which is the 50% retracement level and the lower extreme of the current range. Closes below 377.69, may suggest a negative sentiment shift which could result in further price declines.
A closing break below 377.69 may open scope for further downside pressure toward the next support at 370.92 (61.8% retracement level). A closing break below 370.92 could expose potential for moves toward 349.19, which is the June 25th session low.
The material provided here has not been prepared accordance with legal requirements designed to promote the independence of investment research and as such is considered to be a marketing communication. Whilst it is not subject to any prohibition on dealing ahead of the dissemination of investment research, we will not seek to take any advantage before providing it to our clients.
Pepperstone doesn’t represent that the material provided here is accurate, current or complete, and therefore shouldn’t be relied upon as such. The information, whether from a third party or not, isn’t to be considered as a recommendation; or an offer to buy or sell; or the solicitation of an offer to buy or sell any security, financial product or instrument; or to participate in any particular trading strategy. It does not take into account readers’ financial situation or investment objectives. We advise any readers of this content to seek their own advice. Without the approval of Pepperstone, reproduction or redistribution of this information isn’t permitted.

Global risk Warning CFDs are complex instruments and come with a high risk of losing money rapidly due to leverage. Between 74-89% of retail investor accounts lose money when trading in CFDs. You should consider whether you understand how CFD
Aviso legal
As informações e publicações não se destinam a ser, e não constituem, conselhos ou recomendações financeiras, de investimento, comerciais ou de outro tipo fornecidos ou endossados pela TradingView. Leia mais nos Termos de Uso.
Global risk Warning CFDs are complex instruments and come with a high risk of losing money rapidly due to leverage. Between 74-89% of retail investor accounts lose money when trading in CFDs. You should consider whether you understand how CFD
Aviso legal
As informações e publicações não se destinam a ser, e não constituem, conselhos ou recomendações financeiras, de investimento, comerciais ou de outro tipo fornecidos ou endossados pela TradingView. Leia mais nos Termos de Uso.