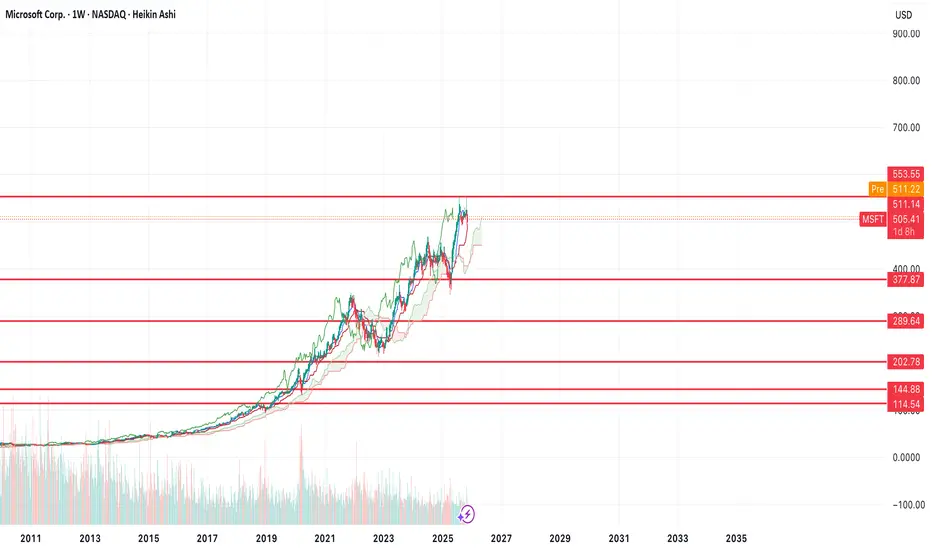
 MSFT looks like it has put in a top up at the $555 level.
This is actually one of the most bearish looking charts as I think there's potentially a longer term top being put in here.
I think it's possible that price goes to at least the $287 level, but potentially all the way down to the lower supports in the low $100s before it can see a sustained bounce.

Aviso legal
As informações e publicações não se destinam a ser, e não constituem, conselhos ou recomendações financeiras, de investimento, comerciais ou de outro tipo fornecidos ou endossados pela TradingView. Leia mais nos Termos de Uso.
Aviso legal
As informações e publicações não se destinam a ser, e não constituem, conselhos ou recomendações financeiras, de investimento, comerciais ou de outro tipo fornecidos ou endossados pela TradingView. Leia mais nos Termos de Uso.