
Analisi su MSTR aiutami a tradurre in inglese ed eventualmente correggi errori di battutura
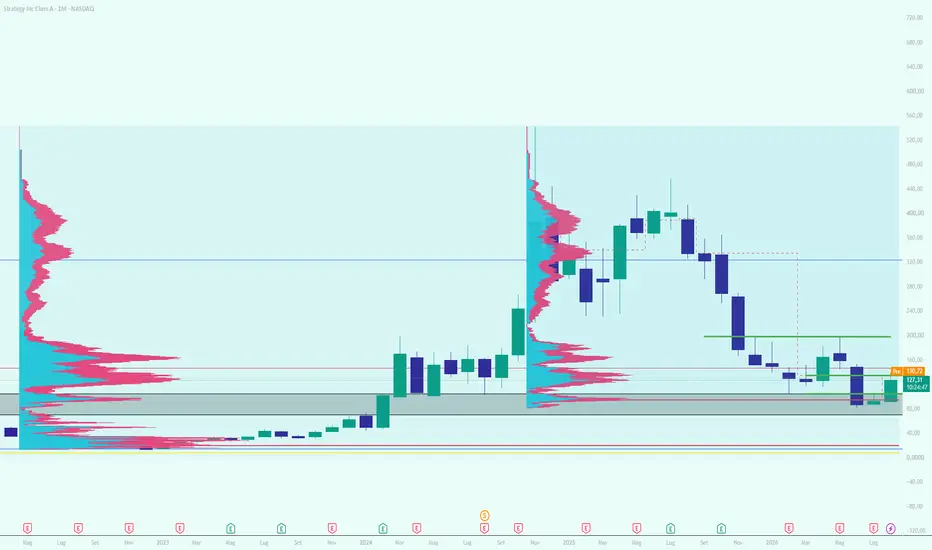
MSTR trova un rimbalzo in un area volumetrica interessante, che coincide con il livello di supporto, che equivale alla vecchia area di top del 2021, questo potrebbe trasformarsi nel nuovo punto di supporto, per piazzare delle entrate ad un buon prezzo.
Nel grafico Daily vediamo come il prezzo viene respintoin area di resistenza dei 138.2$ area in cui si trovava precedentemente il poc. Il superamento di questa soglia segnerebbe il primo vero segnale bullish per il titolo, accennando ad un cambio strutturale da laterale a rialzista dato che il poc si è recentemente spostato sotto il prezzo che potrebbe farlo spingere. Niente ci assicura che questo titolo abbia toccato il fondo , dopo un calo del 85% dai massimi, ma potrebbe essere una buona occasione per comprare il titolo a prezzi bassi, in vista di una futura ripresa di Bitcoin, con cui sembra fortemente correlato.
Ecco i livelli chiave di supporto per sostenere il range di prezzo:
- Supporto 104.61$-109.22$
- Supporto 85.5$ -94.6$
Livelli chiave di resistenza che se superati ci porterebbero ad uno scenario rialzista che il prezzo deve rompere con forza ed acettare:
- Prima resistenza della struttura interna del range 135$
- Resistenza al poc 135.12
- Area di rottura della struttura 197$-213$
Personalmente credo che il prezzo seguirà la tendenza di BTC, quindi seguendo le serie storie , cicliche, il prezzo potrebbe avere una tendenza rialzista in vista dei prossimi 3 anni circa.
Ovviamente ci vuole una buona gestione del rischio ed entrare poco alla volta, una volta decisa quale percentuale del portafoglio allocare a questo titolo.
MSTR finds a bounce in an interesting volume area, which coincides with the support level, equivalent to the old 2021 top area. This could turn into the new support point, for placing entries at a good price.
On the Daily chart we can see how the price gets rejected at the $138.2 resistance area, an area where the POC was previously located. Breaking above this threshold would mark the first real bullish signal for the stock, hinting at a structural shift from sideways to bullish, given that the POC has recently moved below the price, which could push it upward. Nothing guarantees that this stock has bottomed out, after an 85% drop from its highs, but it could be a good opportunity to buy the stock at low prices, ahead of a future Bitcoin recovery, with which it seems strongly correlated.
Here are the key support levels to sustain the price range:
Support $104.61-$109.22
Support $85.5-$94.6
Key resistance levels that, if broken, would lead us to a bullish scenario, which the price needs to break through and accept with strength:
First resistance of the internal range structure $135
POC resistance $135.12
Structure breakout area $197-$213
Personally I believe the price will follow BTC's trend, so following the historical, cyclical series, the price could have a bullish tendency looking ahead to the next 3 years or so.
Obviously good risk management is needed, entering little by little, once you've decided what percentage of the portfolio to allocate to this stock.

Aviso legal
As informações e publicações não se destinam a ser, e não constituem, conselhos ou recomendações financeiras, de investimento, comerciais ou de outro tipo fornecidos ou endossados pela TradingView. Leia mais nos Termos de Uso.
Aviso legal
As informações e publicações não se destinam a ser, e não constituem, conselhos ou recomendações financeiras, de investimento, comerciais ou de outro tipo fornecidos ou endossados pela TradingView. Leia mais nos Termos de Uso.