
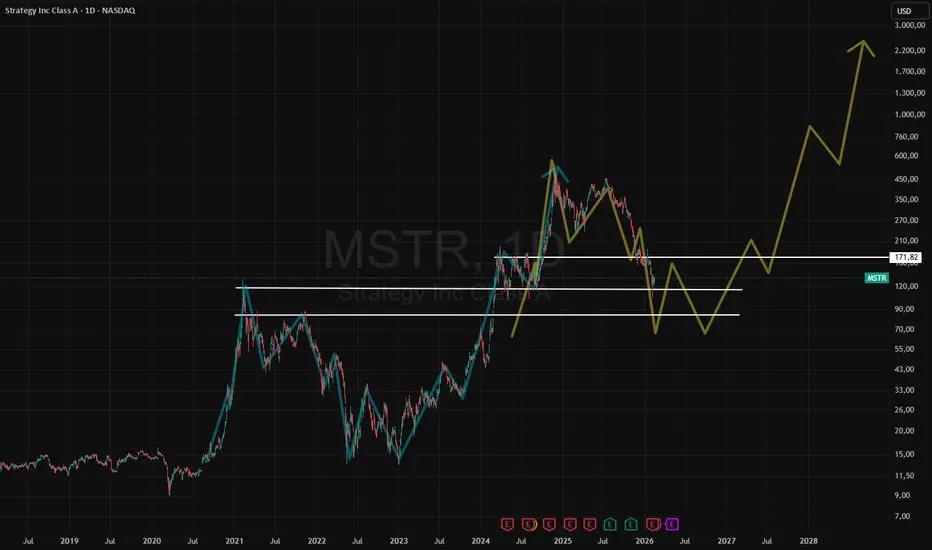
Current Price: ~US$134.79 (recent close).
Context: MSTR is strongly correlated to Bitcoin, acting as leverage for the digital asset.
Chart (log):
- Long-term trend is still bullish, but the price is correcting from the 2024-2025 highs.
- Historical support in the US$100-130 region (currently tested).
- Immediate resistance at US$150-170; a break above this could indicate a recovery.
SSR indicator (in the subchart):
- Apparent value of 0.62 (normalized SSR) → well below 1.0, indicating an excess of stablecoins relative to BTC.
- This signals high available purchasing power, historically preceding upward movements in Bitcoin.
Conclusion:
- The scenario is favorable for MSTR in the medium term, given the accumulation of liquidity (low SSR) and the price testing relevant support.
- Confirmation would come with a break above $150 and/or a recovery in Bitcoin.
Risk: Loss of support at $100 could extend the correction.
Context: MSTR is strongly correlated to Bitcoin, acting as leverage for the digital asset.
Chart (log):
- Long-term trend is still bullish, but the price is correcting from the 2024-2025 highs.
- Historical support in the US$100-130 region (currently tested).
- Immediate resistance at US$150-170; a break above this could indicate a recovery.
SSR indicator (in the subchart):
- Apparent value of 0.62 (normalized SSR) → well below 1.0, indicating an excess of stablecoins relative to BTC.
- This signals high available purchasing power, historically preceding upward movements in Bitcoin.
Conclusion:
- The scenario is favorable for MSTR in the medium term, given the accumulation of liquidity (low SSR) and the price testing relevant support.
- Confirmation would come with a break above $150 and/or a recovery in Bitcoin.
Risk: Loss of support at $100 could extend the correction.

Aviso legal
As informações e publicações não se destinam a ser, e não constituem, conselhos ou recomendações financeiras, de investimento, comerciais ou de outro tipo fornecidos ou endossados pela TradingView. Leia mais nos Termos de Uso.
Aviso legal
As informações e publicações não se destinam a ser, e não constituem, conselhos ou recomendações financeiras, de investimento, comerciais ou de outro tipo fornecidos ou endossados pela TradingView. Leia mais nos Termos de Uso.