
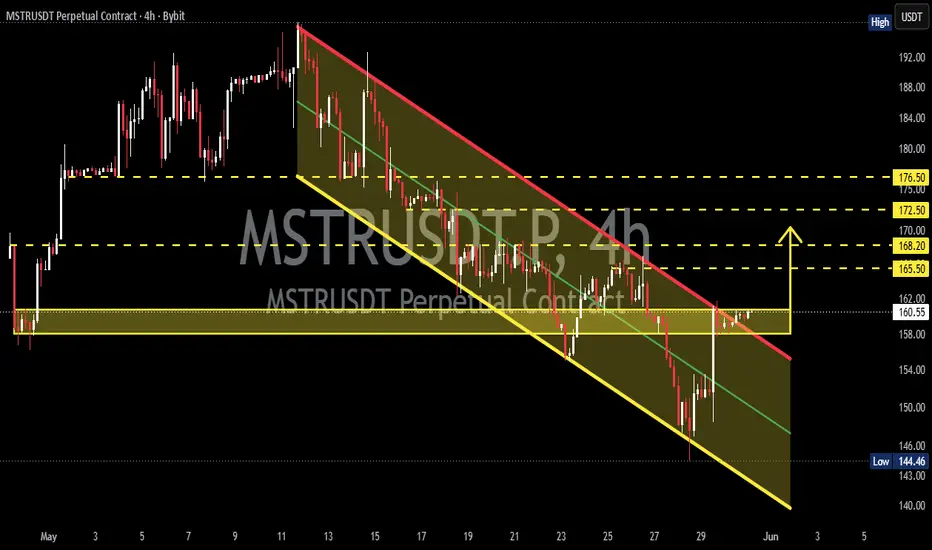
On the 4-hour timeframe, MSTRUSDT is still moving within a Descending Channel that has been developing since the peak around 194 USDT. This structure indicates that the market remains in a correction phase, forming a consistent sequence of Lower Highs (LH) and Lower Lows (LL). 📉
However, after reaching a low near 144 USDT, the price managed to stage a strong rebound 🚀 and is now retesting the important Demand Zone at 158.0 – 160.7 USDT (yellow block).
At the moment, this area serves as a major decision point that could determine the next market direction. ⚡
---
📐 Pattern Formation: Descending Channel
A Descending Channel is a pattern formed when price moves between two parallel downward-sloping trendlines.
🔍 Key Characteristics Visible on the Chart:
✅ Lower Highs continue to form along the upper trendline.
✅ Lower Lows continue to form along the lower trendline.
✅ Price is currently retesting the upper resistance boundary of the channel.
✅ The reclaim of the 158.0–160.7 demand zone suggests that buyers are beginning to step back into the market.
📚 From a technical perspective, a breakout above a Descending Channel often signals the early stages of a trend reversal from bearish to bullish.
---
🟨 Key Levels to Watch
🛡️ Demand Zone
158.0 – 160.7 USDT
This area currently acts as the primary support zone.
If price can maintain strength above this zone, the probability of a recovery toward higher resistance levels increases significantly. 📈
---
🎯 Major Resistance Levels
🔸 165.50 USDT
🔸 168.20 USDT
🔸 172.50 USDT
🔸 176.50 USDT
These horizontal resistance levels are clearly marked on the chart and could become the next upside targets if a breakout occurs. 🚀
---
🟢 Bullish Scenario
✅ Bullish Confirmation
✔️ Price holds above the 158.0–160.7 demand zone.
✔️ Breakout above the upper Descending Channel trendline.
✔️ Increased buying volume during the breakout.
If this scenario unfolds, potential upside targets include:
🎯 165.50 USDT
🎯 168.20 USDT
🎯 172.50 USDT
🎯 176.50 USDT
🔥 A successful breakout above 176.50 USDT would invalidate the short-term bearish structure and open the door for a larger bullish continuation.
---
🔴 Bearish Scenario
❌ Bearish Confirmation
✖️ Price fails to hold the 158.0–160.7 demand zone.
✖️ Strong rejection from the upper channel trendline.
✖️ Price falls back into the channel with increasing selling pressure.
If this scenario occurs, downside targets could include:
🎯 154.00 USDT
🎯 150.00 USDT
🎯 146.00 USDT
🎯 Lower channel support around 140–142 USDT
⚠️ As long as price remains inside the Descending Channel, the medium-term trend remains bearish.
---
📌 Conclusion
MSTRUSDT is currently trading at a critical decision point after reclaiming the 158.0–160.7 USDT demand zone. This area now serves as a crucial foundation for buyers attempting to push the price out of the Descending Channel that has dominated the market for several weeks.
🚀 A confirmed breakout from the channel could trigger a rally toward the 165–176 USDT region.
📉 On the other hand, failure to defend the demand zone could result in another move back toward previous lows.
👀 Traders should closely monitor price action around the 158.0–160.7 USDT zone and watch for a potential breakout above the channel resistance for confirmation of the next directional move.
---
⚠️ Disclaimer
This analysis is for educational purposes only and should not be considered financial advice. Always conduct your own research and apply proper risk management before making trading decisions.
#MSTRUSDT #MSTR #Crypto #Cryptocurrency #TradingView #TechnicalAnalysis #PriceAction #DescendingChannel #BullishBreakout #BearishTrend #SupportResistance #CryptoTrading #AltcoinAnalysis #Bybit #FuturesTrading #MarketStructure #TrendAnalysis #SmartMoney #TradingSetup #ChartAnalysis
However, after reaching a low near 144 USDT, the price managed to stage a strong rebound 🚀 and is now retesting the important Demand Zone at 158.0 – 160.7 USDT (yellow block).
At the moment, this area serves as a major decision point that could determine the next market direction. ⚡
---
📐 Pattern Formation: Descending Channel
A Descending Channel is a pattern formed when price moves between two parallel downward-sloping trendlines.
🔍 Key Characteristics Visible on the Chart:
✅ Lower Highs continue to form along the upper trendline.
✅ Lower Lows continue to form along the lower trendline.
✅ Price is currently retesting the upper resistance boundary of the channel.
✅ The reclaim of the 158.0–160.7 demand zone suggests that buyers are beginning to step back into the market.
📚 From a technical perspective, a breakout above a Descending Channel often signals the early stages of a trend reversal from bearish to bullish.
---
🟨 Key Levels to Watch
🛡️ Demand Zone
158.0 – 160.7 USDT
This area currently acts as the primary support zone.
If price can maintain strength above this zone, the probability of a recovery toward higher resistance levels increases significantly. 📈
---
🎯 Major Resistance Levels
🔸 165.50 USDT
🔸 168.20 USDT
🔸 172.50 USDT
🔸 176.50 USDT
These horizontal resistance levels are clearly marked on the chart and could become the next upside targets if a breakout occurs. 🚀
---
🟢 Bullish Scenario
✅ Bullish Confirmation
✔️ Price holds above the 158.0–160.7 demand zone.
✔️ Breakout above the upper Descending Channel trendline.
✔️ Increased buying volume during the breakout.
If this scenario unfolds, potential upside targets include:
🎯 165.50 USDT
🎯 168.20 USDT
🎯 172.50 USDT
🎯 176.50 USDT
🔥 A successful breakout above 176.50 USDT would invalidate the short-term bearish structure and open the door for a larger bullish continuation.
---
🔴 Bearish Scenario
❌ Bearish Confirmation
✖️ Price fails to hold the 158.0–160.7 demand zone.
✖️ Strong rejection from the upper channel trendline.
✖️ Price falls back into the channel with increasing selling pressure.
If this scenario occurs, downside targets could include:
🎯 154.00 USDT
🎯 150.00 USDT
🎯 146.00 USDT
🎯 Lower channel support around 140–142 USDT
⚠️ As long as price remains inside the Descending Channel, the medium-term trend remains bearish.
---
📌 Conclusion
MSTRUSDT is currently trading at a critical decision point after reclaiming the 158.0–160.7 USDT demand zone. This area now serves as a crucial foundation for buyers attempting to push the price out of the Descending Channel that has dominated the market for several weeks.
🚀 A confirmed breakout from the channel could trigger a rally toward the 165–176 USDT region.
📉 On the other hand, failure to defend the demand zone could result in another move back toward previous lows.
👀 Traders should closely monitor price action around the 158.0–160.7 USDT zone and watch for a potential breakout above the channel resistance for confirmation of the next directional move.
---
⚠️ Disclaimer
This analysis is for educational purposes only and should not be considered financial advice. Always conduct your own research and apply proper risk management before making trading decisions.
#MSTRUSDT #MSTR #Crypto #Cryptocurrency #TradingView #TechnicalAnalysis #PriceAction #DescendingChannel #BullishBreakout #BearishTrend #SupportResistance #CryptoTrading #AltcoinAnalysis #Bybit #FuturesTrading #MarketStructure #TrendAnalysis #SmartMoney #TradingSetup #ChartAnalysis

✅ Get Free Signals! Join Our Telegram Channel Here: t.me/TheCryptoNuclear
✅ Twitter: twitter.com/crypto_nuclear
✅ Join Bybit : partner.bybit.com/b/nuclearvip
✅ Benefits : Lifetime Trading Fee Discount -50%
✅ Twitter: twitter.com/crypto_nuclear
✅ Join Bybit : partner.bybit.com/b/nuclearvip
✅ Benefits : Lifetime Trading Fee Discount -50%
Aviso legal
As informações e publicações não se destinam a ser, e não constituem, conselhos ou recomendações financeiras, de investimento, comerciais ou de outro tipo fornecidos ou endossados pela TradingView. Leia mais nos Termos de Uso.
✅ Get Free Signals! Join Our Telegram Channel Here: t.me/TheCryptoNuclear
✅ Twitter: twitter.com/crypto_nuclear
✅ Join Bybit : partner.bybit.com/b/nuclearvip
✅ Benefits : Lifetime Trading Fee Discount -50%
✅ Twitter: twitter.com/crypto_nuclear
✅ Join Bybit : partner.bybit.com/b/nuclearvip
✅ Benefits : Lifetime Trading Fee Discount -50%
Aviso legal
As informações e publicações não se destinam a ser, e não constituem, conselhos ou recomendações financeiras, de investimento, comerciais ou de outro tipo fornecidos ou endossados pela TradingView. Leia mais nos Termos de Uso.