
MUGHAL: Recovery Rally Continues, But a Big Test Lies Ahead
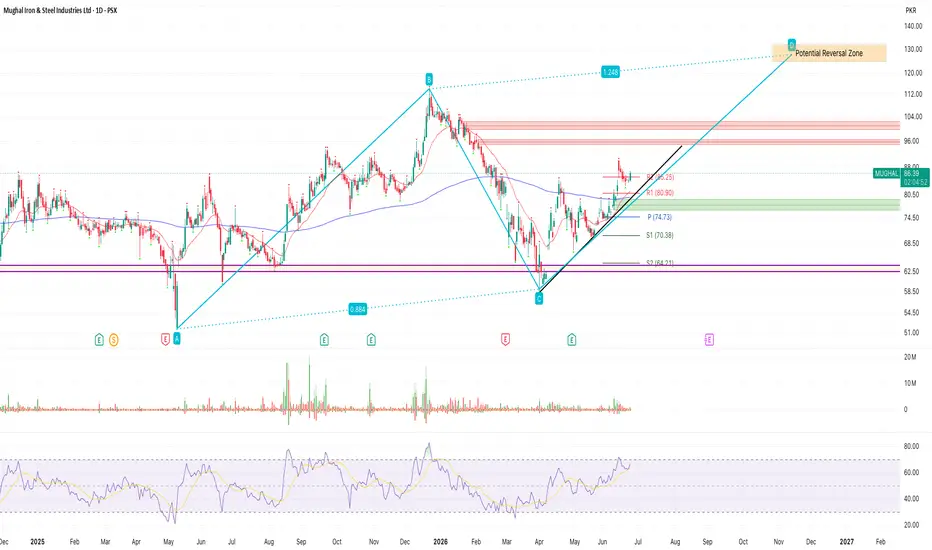
MUGHAL has quietly staged a strong recovery over the last few months. After finding support near the 58-60 area earlier this year, the stock has been making higher highs and higher lows, which is usually a positive sign for the overall trend.
One of the encouraging developments on the chart is that the stock has managed to reclaim its long-term moving average and has held above it despite recent market fluctuations. Buyers continue to step in on dips, keeping the short-term trend intact.
However, the stock is now approaching an area that could decide its next major move.
Key Resistance Levels
🔹 88-90 (Immediate resistance)
🔹 95-100 (Major supply zone)
🔹 125-130 (Potential medium-term target)
The 95-100 region stands out as an important area because the stock has struggled there in the past. It's also a zone where long-term sellers may become active again.
Key Support Levels
🔹 80-81
🔹 74-75
🔹 63-65
As long as the stock continues to hold above these support areas, the broader recovery story remains intact.
Bullish Scenario
The chart continues to look constructive.
If MUGHAL manages to break above 90 and then successfully clear the 95-100 supply zone, the next leg higher could begin.
🎯 Target 1: 100
🎯 Target 2: 112
🎯 Target 3: 125-130
The recent price action suggests that buyers are gradually gaining control, and a breakout above the supply zone could attract fresh momentum.
Bearish Scenario
Not every resistance breaks on the first attempt.
If the stock faces rejection around the 95-100 area, some profit-taking should be expected after the strong rally from the lows.
In that case, the first levels to watch would be 80 and then 75.
A pullback toward these levels would still be considered normal within an overall improving trend. The chart would only start to weaken if price closes below the 74-75 support zone.
Final Thoughts
For me, the chart remains positive, but the real battle lies in the 95-100 zone.
The stock has already done a lot of hard work by recovering from its lows and rebuilding a bullish structure. The next step is to see whether buyers have enough strength to absorb supply and push the stock into triple digits.
I'll be watching the 95-100 area closely over the coming weeks.
Disclaimer: This analysis reflects my personal view of the chart and is shared for educational purposes only. Please do your own research before making any investment decisions.
#MUGHAL #PSX #PakistanStockExchange #TechnicalAnalysis #ChartAnalysis #PriceAction #SwingTrading #Breakout #Bullish #SupportAndResistance #StocksToWatch #SteelSector #Investing #TradingView #MarketAnalysis
MUGHAL has quietly staged a strong recovery over the last few months. After finding support near the 58-60 area earlier this year, the stock has been making higher highs and higher lows, which is usually a positive sign for the overall trend.
One of the encouraging developments on the chart is that the stock has managed to reclaim its long-term moving average and has held above it despite recent market fluctuations. Buyers continue to step in on dips, keeping the short-term trend intact.
However, the stock is now approaching an area that could decide its next major move.
Key Resistance Levels
🔹 88-90 (Immediate resistance)
🔹 95-100 (Major supply zone)
🔹 125-130 (Potential medium-term target)
The 95-100 region stands out as an important area because the stock has struggled there in the past. It's also a zone where long-term sellers may become active again.
Key Support Levels
🔹 80-81
🔹 74-75
🔹 63-65
As long as the stock continues to hold above these support areas, the broader recovery story remains intact.
Bullish Scenario
The chart continues to look constructive.
If MUGHAL manages to break above 90 and then successfully clear the 95-100 supply zone, the next leg higher could begin.
🎯 Target 1: 100
🎯 Target 2: 112
🎯 Target 3: 125-130
The recent price action suggests that buyers are gradually gaining control, and a breakout above the supply zone could attract fresh momentum.
Bearish Scenario
Not every resistance breaks on the first attempt.
If the stock faces rejection around the 95-100 area, some profit-taking should be expected after the strong rally from the lows.
In that case, the first levels to watch would be 80 and then 75.
A pullback toward these levels would still be considered normal within an overall improving trend. The chart would only start to weaken if price closes below the 74-75 support zone.
Final Thoughts
For me, the chart remains positive, but the real battle lies in the 95-100 zone.
The stock has already done a lot of hard work by recovering from its lows and rebuilding a bullish structure. The next step is to see whether buyers have enough strength to absorb supply and push the stock into triple digits.
I'll be watching the 95-100 area closely over the coming weeks.
Disclaimer: This analysis reflects my personal view of the chart and is shared for educational purposes only. Please do your own research before making any investment decisions.
#MUGHAL #PSX #PakistanStockExchange #TechnicalAnalysis #ChartAnalysis #PriceAction #SwingTrading #Breakout #Bullish #SupportAndResistance #StocksToWatch #SteelSector #Investing #TradingView #MarketAnalysis

Aviso legal
As informações e publicações não se destinam a ser, e não constituem, conselhos ou recomendações financeiras, de investimento, comerciais ou de outro tipo fornecidos ou endossados pela TradingView. Leia mais nos Termos de Uso.
Aviso legal
As informações e publicações não se destinam a ser, e não constituem, conselhos ou recomendações financeiras, de investimento, comerciais ou de outro tipo fornecidos ou endossados pela TradingView. Leia mais nos Termos de Uso.