Long
NANO Is Ready To Boom (Weekly Chart) (235%+ Ahead)
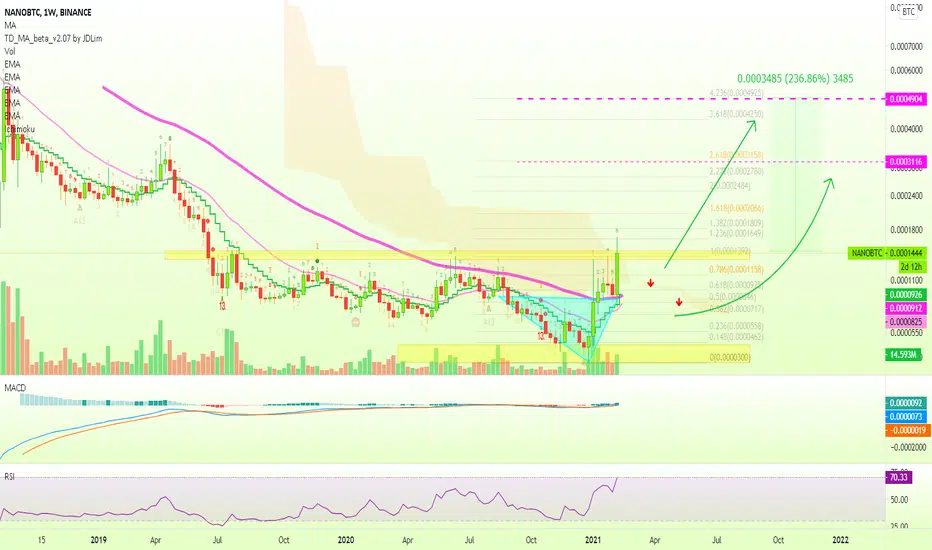
NANOBTC is really ready for some strong bullish action.
Right now we are facing resistance on this weekly chart, yellow space, which will determine what happens next.
We have a "fake breakdown" marked with a light blue triangle.
We have prices strongly above EMA50.
The MACD above zero (weekly).
The RSI above 70 (weekly = ULTRA-strong).
All these signals are pointing to higher prices... The next two targets are marked on the chart.
Namaste.
Right now we are facing resistance on this weekly chart, yellow space, which will determine what happens next.
We have a "fake breakdown" marked with a light blue triangle.
We have prices strongly above EMA50.
The MACD above zero (weekly).
The RSI above 70 (weekly = ULTRA-strong).
All these signals are pointing to higher prices... The next two targets are marked on the chart.
Namaste.

Trading Cryptocurrencies can be the hardest undertaking ever without the right trade-numbers, without accurate private-access information. Free is free, but the best always requires sweat, an investment. Since 2017 👇
t.me/masteranandatrades/8778
t.me/masteranandatrades/8778
Publicações relacionadas
Aviso legal
As informações e publicações não se destinam a ser, e não constituem, conselhos ou recomendações financeiras, de investimento, comerciais ou de outro tipo fornecidos ou endossados pela TradingView. Leia mais nos Termos de Uso.
Trading Cryptocurrencies can be the hardest undertaking ever without the right trade-numbers, without accurate private-access information. Free is free, but the best always requires sweat, an investment. Since 2017 👇
t.me/masteranandatrades/8778
t.me/masteranandatrades/8778
Publicações relacionadas
Aviso legal
As informações e publicações não se destinam a ser, e não constituem, conselhos ou recomendações financeiras, de investimento, comerciais ou de outro tipo fornecidos ou endossados pela TradingView. Leia mais nos Termos de Uso.