
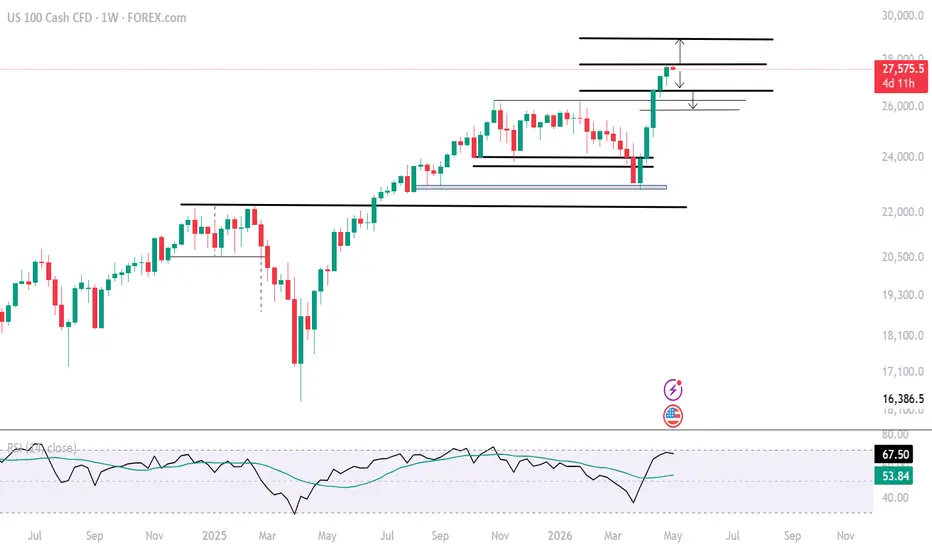
From a weekly perspective, Nasdaq momentum is showing signs of slowing near overbought levels, similar to prior peaks seen in 2024 and 2025. This raises the risk of a pullback or momentum unwind as markets realize the Q2 pressure from Hormuz-related risks over Q1 earnings.
Key levels to watch, derived using Fibonacci extensions between the April 2025 lows, October 2025 highs, and April 2026 lows, are:
27,800 (0.5)
28,900 (0.618)
30,660 (0.786)
On the downside, a break below 26,900 would reinforce a pullback toward 26,300, 26,100, and 25800, levels representing potential rebound opportunities
Written by Razan Hilal, CMT

Aviso legal
As informações e publicações não se destinam a ser, e não constituem, conselhos ou recomendações financeiras, de investimento, comerciais ou de outro tipo fornecidos ou endossados pela TradingView. Leia mais nos Termos de Uso.
Aviso legal
As informações e publicações não se destinam a ser, e não constituem, conselhos ou recomendações financeiras, de investimento, comerciais ou de outro tipo fornecidos ou endossados pela TradingView. Leia mais nos Termos de Uso.