
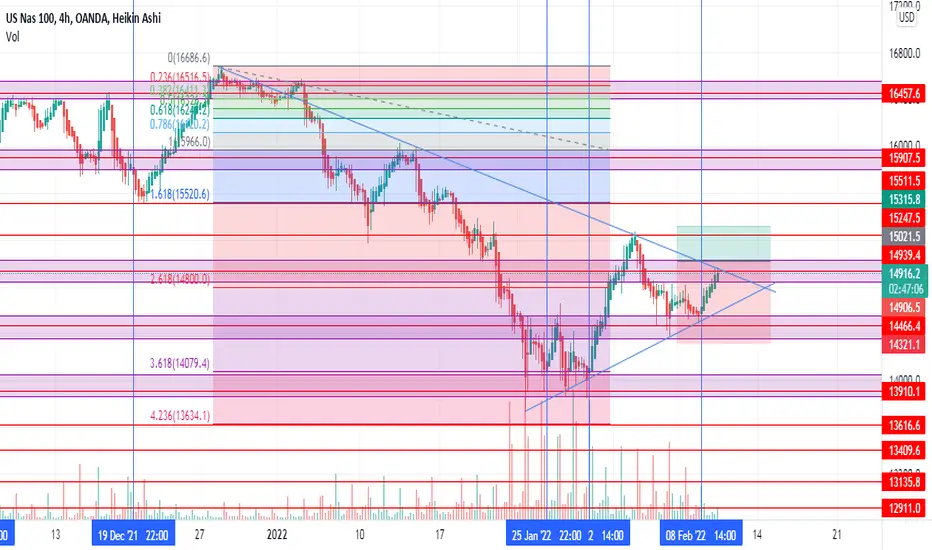
On the Daily timeframe we see a clear downtrend. It touches the trendline more than 5 times, indicating the correct direction of the market. If the market breaks the trendline it should head to the 15072.9 area. On the 4H we see some price action in the key area or golden area, the 618 on the Fibonacci retracement. If it does not break the trendline, it should come down to 14649.3 whhere it should bounce off the trendline and go up.

Aviso legal
As informações e publicações não se destinam a ser, e não constituem, conselhos ou recomendações financeiras, de investimento, comerciais ou de outro tipo fornecidos ou endossados pela TradingView. Leia mais nos Termos de Uso.
Aviso legal
As informações e publicações não se destinam a ser, e não constituem, conselhos ou recomendações financeiras, de investimento, comerciais ou de outro tipo fornecidos ou endossados pela TradingView. Leia mais nos Termos de Uso.