
(Not financial advice)
I will post notes below the main chart with screenshots to these other times mentioned.
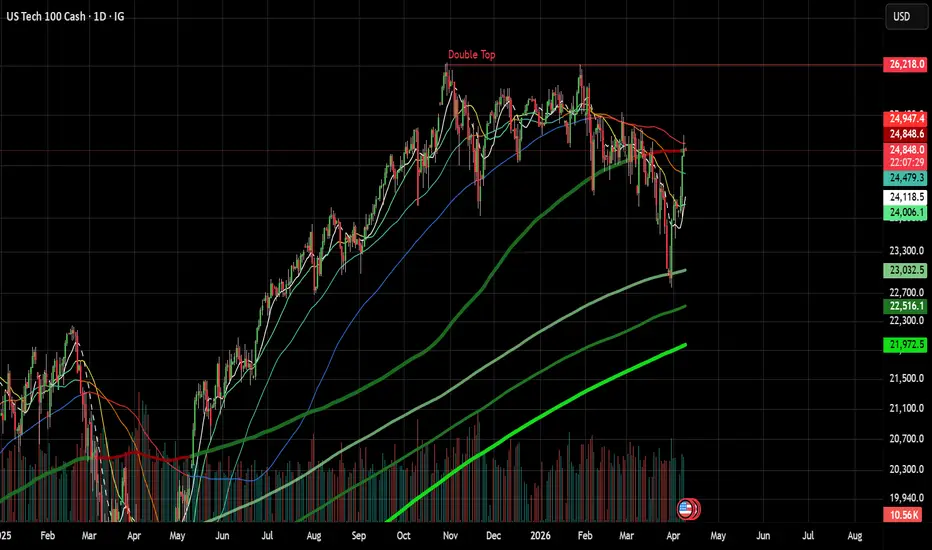
The 10 and 20sma's crossed below the 200 Mid-March, and we found support at the 400sma. I looked at 13 past tops or major corrections, and only 2/13 times did we bottom at the 400sma. I'm thinking at a minimum, we pull back to 24,100 and see how price responds. If the 10sma can sustain mostly above the 20sma and price holds above 24,100 then a bullish case can start forming. But not yet. Personally, I think we just saw capitulation to the upside, but this is a weird chart.
In these 9 instances when the 10sma and 20sma crossed below the 200sma -- which has happened 3 weeks ago --
2025, 2022, 2020, 2018, 2016, 2015, 2008, 2006, 2000.
In these 4 instances, price still went down to lower lows, but not quite as extreme:
2012, where price did not have much of a relief rally as we saw this week, and only retraced down to the 400sma. I would argue that this move in 2012 was just part of a larger correction.
2011 - price went down to the 500sma, also part of a larger correction.
2005 - Price went down to the 500sma
2004 - Price went down to the 400sma
I will post notes below the main chart with screenshots to these other times mentioned.
The 10 and 20sma's crossed below the 200 Mid-March, and we found support at the 400sma. I looked at 13 past tops or major corrections, and only 2/13 times did we bottom at the 400sma. I'm thinking at a minimum, we pull back to 24,100 and see how price responds. If the 10sma can sustain mostly above the 20sma and price holds above 24,100 then a bullish case can start forming. But not yet. Personally, I think we just saw capitulation to the upside, but this is a weird chart.
In these 9 instances when the 10sma and 20sma crossed below the 200sma -- which has happened 3 weeks ago --
2025, 2022, 2020, 2018, 2016, 2015, 2008, 2006, 2000.
In these 4 instances, price still went down to lower lows, but not quite as extreme:
2012, where price did not have much of a relief rally as we saw this week, and only retraced down to the 400sma. I would argue that this move in 2012 was just part of a larger correction.
2011 - price went down to the 500sma, also part of a larger correction.
2005 - Price went down to the 500sma
2004 - Price went down to the 400sma
Nota
2025Nota
2022Nota
2020Nota
2018Nota
2015 & 2016Nota
2012Nota
2011Nota
2010Nota
2008Nota
2006Nota
2004 and 2005Nota
2000
Aviso legal
As informações e publicações não se destinam a ser, e não constituem, conselhos ou recomendações financeiras, de investimento, comerciais ou de outro tipo fornecidos ou endossados pela TradingView. Leia mais nos Termos de Uso.
Aviso legal
As informações e publicações não se destinam a ser, e não constituem, conselhos ou recomendações financeiras, de investimento, comerciais ou de outro tipo fornecidos ou endossados pela TradingView. Leia mais nos Termos de Uso.