
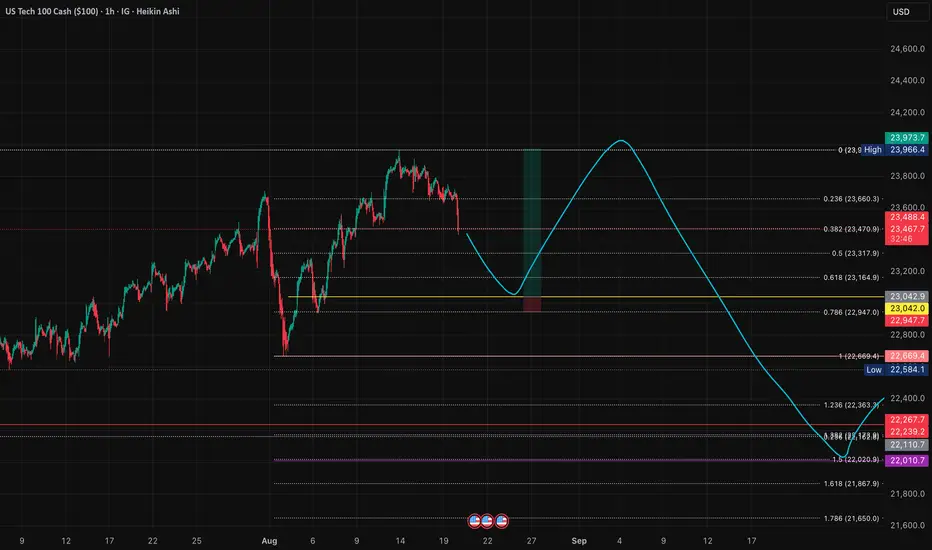
Sharing my current outlook on NASDAQ with a high-probability setup offering exceptional risk-reward. 📊
**🎯 The Setup:**
I'm expecting one more push to new all-time highs from the yellow line around 23,000. This would offer a **10:1 risk-to-reward ratio** with the stop loss just below the recent low. 🚀
**📍 Yellow Line Logic:**
This level represents my experience-based zone just shy of the 0.786 Fibonacci retracement. I've observed that when price reaches the 0.786 level, it tends to result in a complete reversal more often than not. This yellow line sits in that "sweet spot" where buyers typically step in. 🎯
**📈 Chart Structure Support:**
The overall chart pattern suggests a higher probability of making new highs rather than a complete reversal from current levels. The structure is bullish despite the recent pullback. ✅
**🔄 Bigger Picture Scenario:**
After the anticipated new high, I expect a significant retracement back toward the previous high (red line area). However, this would likely be just a healthy correction before the bull run resumes for the remainder of the year. 📉➡️📈
**🧠 Key Insight:**
Sometimes the best trades come when the market gives you that "one more push" setup. The risk is small relative to the potential reward, making this a compelling opportunity if the setup materializes. 💡
📈 **This trade setup offers a risk-to-reward ratio of 10:1.** Without including fees, the breakeven win rate for this trade would be approximately 9.09%. Knowing these figures in advance helps me avoid emotional trading. 🧠
💡 **Pro Tip**: If you often find yourself trading based on emotions, I recommend doing this type of pre-planning and quantifying your setups before execution — it can be a simple yet highly effective improvement. ✅
---
**Trading is simple.** You don't need multiple indicators or dozens of lines on your chart. A clean and simple chart often works best — it keeps your decisions consistent and reduces uncertainty. Sure, it might not look flashy, and my analysis may seem a bit "plain" compared to others… but that's how I like it. If you find this analysis useful, feel free to follow me for more updates.
---
*Disclaimer: This post is for general informational and educational purposes only. It does not constitute financial advice, investment recommendation, or a service targeting specific investors, and should not be considered illegal or restricted information in any jurisdiction.*
**🎯 The Setup:**
I'm expecting one more push to new all-time highs from the yellow line around 23,000. This would offer a **10:1 risk-to-reward ratio** with the stop loss just below the recent low. 🚀
**📍 Yellow Line Logic:**
This level represents my experience-based zone just shy of the 0.786 Fibonacci retracement. I've observed that when price reaches the 0.786 level, it tends to result in a complete reversal more often than not. This yellow line sits in that "sweet spot" where buyers typically step in. 🎯
**📈 Chart Structure Support:**
The overall chart pattern suggests a higher probability of making new highs rather than a complete reversal from current levels. The structure is bullish despite the recent pullback. ✅
**🔄 Bigger Picture Scenario:**
After the anticipated new high, I expect a significant retracement back toward the previous high (red line area). However, this would likely be just a healthy correction before the bull run resumes for the remainder of the year. 📉➡️📈
**🧠 Key Insight:**
Sometimes the best trades come when the market gives you that "one more push" setup. The risk is small relative to the potential reward, making this a compelling opportunity if the setup materializes. 💡
📈 **This trade setup offers a risk-to-reward ratio of 10:1.** Without including fees, the breakeven win rate for this trade would be approximately 9.09%. Knowing these figures in advance helps me avoid emotional trading. 🧠
💡 **Pro Tip**: If you often find yourself trading based on emotions, I recommend doing this type of pre-planning and quantifying your setups before execution — it can be a simple yet highly effective improvement. ✅
---
**Trading is simple.** You don't need multiple indicators or dozens of lines on your chart. A clean and simple chart often works best — it keeps your decisions consistent and reduces uncertainty. Sure, it might not look flashy, and my analysis may seem a bit "plain" compared to others… but that's how I like it. If you find this analysis useful, feel free to follow me for more updates.
---
*Disclaimer: This post is for general informational and educational purposes only. It does not constitute financial advice, investment recommendation, or a service targeting specific investors, and should not be considered illegal or restricted information in any jurisdiction.*
Ordem cancelada
The overall situation looks much worse than expected, so I canceled my orders for now.
Aviso legal
As informações e publicações não se destinam a ser, e não constituem, conselhos ou recomendações financeiras, de investimento, comerciais ou de outro tipo fornecidos ou endossados pela TradingView. Leia mais nos Termos de Uso.
Aviso legal
As informações e publicações não se destinam a ser, e não constituem, conselhos ou recomendações financeiras, de investimento, comerciais ou de outro tipo fornecidos ou endossados pela TradingView. Leia mais nos Termos de Uso.