nasdaq100....h
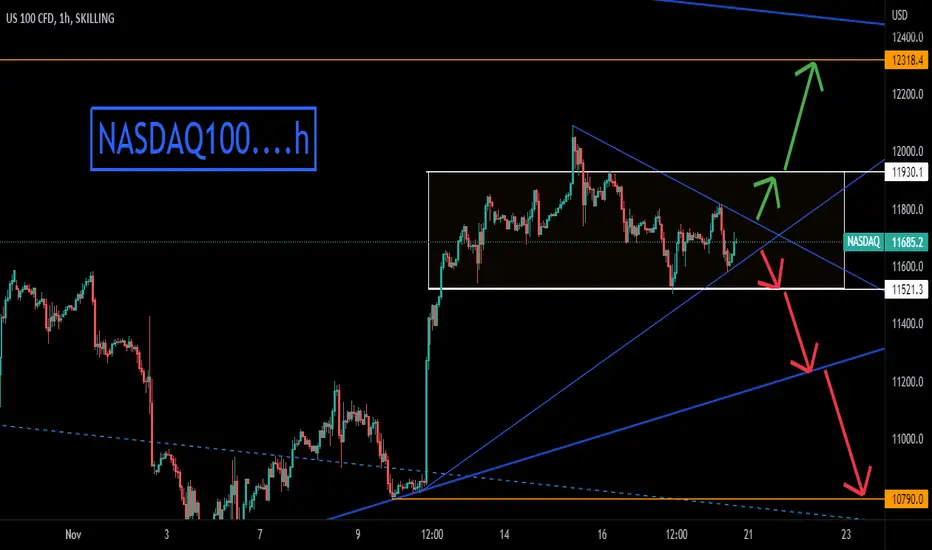
= Nasdaq analysis on the hourly chart
= The analysis is based on trend analysis, support and resistance
= Currently, it is on an occasional path between support and resistance.. breaking it goes to the selling targets... and exceeding it goes to the buying targets
= The analysis is based on trend analysis, support and resistance
= Currently, it is on an occasional path between support and resistance.. breaking it goes to the selling targets... and exceeding it goes to the buying targets

Aviso legal
As informações e publicações não se destinam a ser, e não constituem, conselhos ou recomendações financeiras, de investimento, comerciais ou de outro tipo fornecidos ou endossados pela TradingView. Leia mais nos Termos de Uso.
Aviso legal
As informações e publicações não se destinam a ser, e não constituem, conselhos ou recomendações financeiras, de investimento, comerciais ou de outro tipo fornecidos ou endossados pela TradingView. Leia mais nos Termos de Uso.