
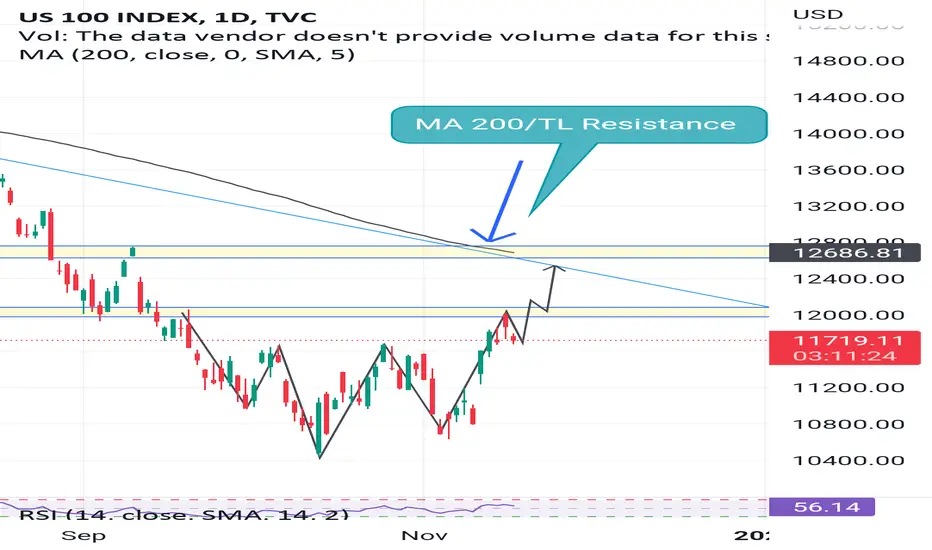
Nasdaq creating inverse head and shoulder pattern on daily chart and now testing the breakout neck line
It can easily go up to upper trendline and 200 Ma area which is also last high low were it has to chance to start fadingout as we are still in bear market 🐻
Micro bulish
Macro bearish
DYOR!
It can easily go up to upper trendline and 200 Ma area which is also last high low were it has to chance to start fadingout as we are still in bear market 🐻
Micro bulish
Macro bearish
DYOR!

Aviso legal
As informações e publicações não se destinam a ser, e não constituem, conselhos ou recomendações financeiras, de investimento, comerciais ou de outro tipo fornecidos ou endossados pela TradingView. Leia mais nos Termos de Uso.
Aviso legal
As informações e publicações não se destinam a ser, e não constituem, conselhos ou recomendações financeiras, de investimento, comerciais ou de outro tipo fornecidos ou endossados pela TradingView. Leia mais nos Termos de Uso.