
Current price: ₹1,454
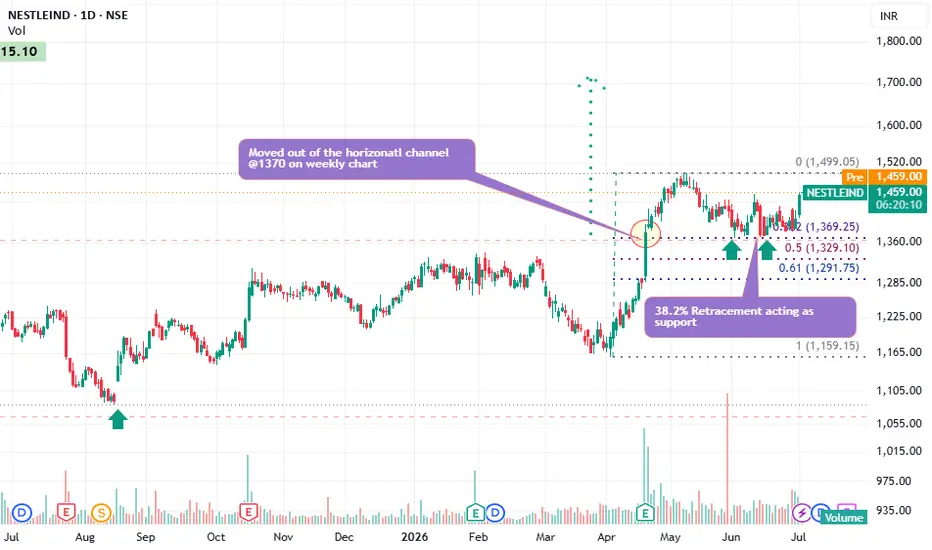
This is a daily chart of Nestlé India with a Fibonacci retracement drawn after a strong breakout. Here's the technical interpretation:
1. Weekly Breakout (Most Bullish Signal) ✅
The stock broke above the long-term horizontal resistance near ₹1,370 on the weekly chart.
Such breakouts after a prolonged consolidation often signal the start of a fresh uptrend.
The sharp rise from around ₹1,180 to ₹1,500 confirms strong buying interest.
Inference: Long-term trend has turned bullish.
2. Fibonacci Retracement
The Fibonacci tool is drawn from the swing low (~₹1,159) to the swing high (~₹1,499).
Key levels:
Fibonacci Level Price Significance
38.2% ₹1,369 Strong support
50% ₹1,329 Medium support
61.8% ₹1,292 Last major support
The stock has repeatedly bounced near ₹1,369, showing that buyers are defending this level.
3. Current Price Action
Current price: ₹1,454
Observations:
Trading above all important Fibonacci levels.
Making higher lows after the breakout.
Consolidating below ₹1,500 instead of falling sharply.
This is generally a sign of strength.
4. Volume Analysis
The breakout was accompanied by high volumes, indicating institutional participation.
During consolidation, volumes have reduced, which is healthy.
Ideally, the next breakout above ₹1,500 should again come with higher volume.
Overall Technical View
Trend: 🟢 Bullish
Momentum: Positive
Structure: Breakout followed by healthy consolidation
Support Strength: Strong at ₹1,370
Probability: As long as the stock holds above ₹1,370, the probability of a move above ₹1,500 remains favorable.
This is a daily chart of Nestlé India with a Fibonacci retracement drawn after a strong breakout. Here's the technical interpretation:
1. Weekly Breakout (Most Bullish Signal) ✅
The stock broke above the long-term horizontal resistance near ₹1,370 on the weekly chart.
Such breakouts after a prolonged consolidation often signal the start of a fresh uptrend.
The sharp rise from around ₹1,180 to ₹1,500 confirms strong buying interest.
Inference: Long-term trend has turned bullish.
2. Fibonacci Retracement
The Fibonacci tool is drawn from the swing low (~₹1,159) to the swing high (~₹1,499).
Key levels:
Fibonacci Level Price Significance
38.2% ₹1,369 Strong support
50% ₹1,329 Medium support
61.8% ₹1,292 Last major support
The stock has repeatedly bounced near ₹1,369, showing that buyers are defending this level.
3. Current Price Action
Current price: ₹1,454
Observations:
Trading above all important Fibonacci levels.
Making higher lows after the breakout.
Consolidating below ₹1,500 instead of falling sharply.
This is generally a sign of strength.
4. Volume Analysis
The breakout was accompanied by high volumes, indicating institutional participation.
During consolidation, volumes have reduced, which is healthy.
Ideally, the next breakout above ₹1,500 should again come with higher volume.
Overall Technical View
Trend: 🟢 Bullish
Momentum: Positive
Structure: Breakout followed by healthy consolidation
Support Strength: Strong at ₹1,370
Probability: As long as the stock holds above ₹1,370, the probability of a move above ₹1,500 remains favorable.

Aviso legal
As informações e publicações não se destinam a ser, e não constituem, conselhos ou recomendações financeiras, de investimento, comerciais ou de outro tipo fornecidos ou endossados pela TradingView. Leia mais nos Termos de Uso.
Aviso legal
As informações e publicações não se destinam a ser, e não constituem, conselhos ou recomendações financeiras, de investimento, comerciais ou de outro tipo fornecidos ou endossados pela TradingView. Leia mais nos Termos de Uso.