 NFLX
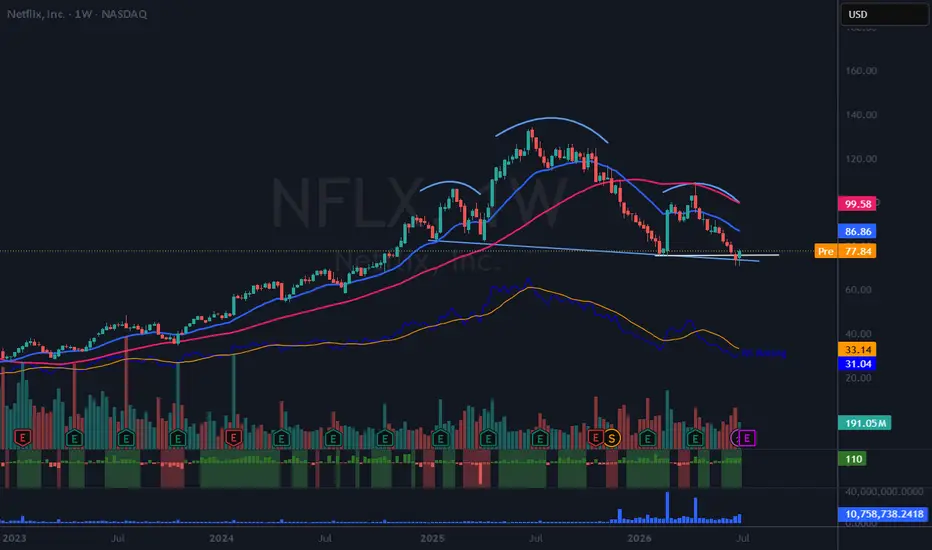
This could be a failed breakdown of a head and shoulders pattern AND an undercut and rally. (White line shows undercut and rally area.) All TBD.
I am back from a much needed 2 week vacation. This one caught my eye. Maybe worth putting on your watchlist.
If I take a position, I'll update this post.
Trade ativo
This trade has been active since breaking above the neckline. Here are my updated thoughts:NFLX appears to have invalidated the head-and-shoulders pattern I previously noted on the weekly chart above.This 65-minute chart shows Netflix forming a flat base over the past two to three days. It is currently my largest position at 2.5 times my normal size, and I may increase it to 3 times normal if it breaks above the upper horizontal line. I believe it can reclaim its recent highs above $106, though I do not expect a straight move higher. I will use a trailing stop on a decisive close below the 21 EMA.

Ideas I publish are my own. They are not meant to be investment / trading advice. You are encouraged to do your own due diligence.
I am under no obligation to post any action or update to any idea.
Follow me on "X" where I post more content.
I am under no obligation to post any action or update to any idea.
Follow me on "X" where I post more content.
Aviso legal
As informações e publicações não se destinam a ser, e não constituem, conselhos ou recomendações financeiras, de investimento, comerciais ou de outro tipo fornecidos ou endossados pela TradingView. Leia mais nos Termos de Uso.
Ideas I publish are my own. They are not meant to be investment / trading advice. You are encouraged to do your own due diligence.
I am under no obligation to post any action or update to any idea.
Follow me on "X" where I post more content.
I am under no obligation to post any action or update to any idea.
Follow me on "X" where I post more content.
Aviso legal
As informações e publicações não se destinam a ser, e não constituem, conselhos ou recomendações financeiras, de investimento, comerciais ou de outro tipo fornecidos ou endossados pela TradingView. Leia mais nos Termos de Uso.